💡 Direct Answer & Executive Summary (Cycling Watts Power Output Estimator)
Definition: Model cycling mechanical power output (Watts) and power-to-weight ratio (W/kg) based on slope incline, rider mass, and speed.
Governing Math Formula: Total Power = (P_gravity + P_aero + P_rolling) / Drivetrain_Efficiency.
Target Applications: Provides real-time quantitative solutions in Sports for students, engineers, researchers, and finance professionals.
Cycling Watts Power Output Estimator: The Complete Biomechanical Physics Guide
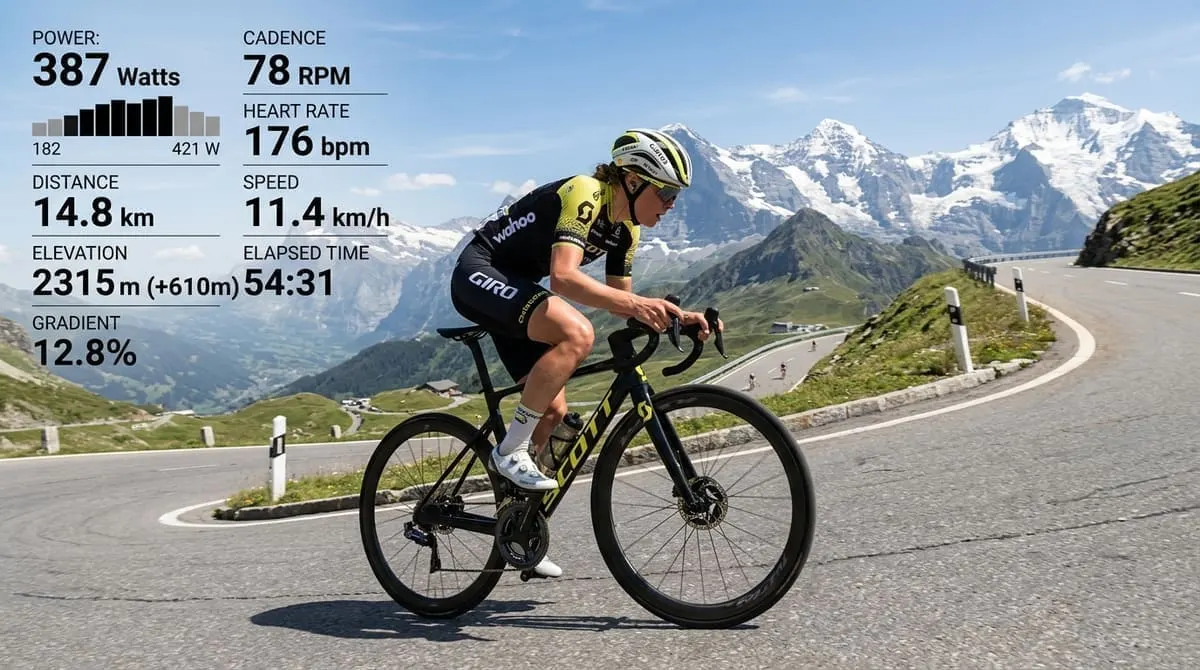
1. Introduction
In road cycling, mountain biking, and triathlon, Mechanical Power Output (measured in Watts) is the ultimate objective metric of physical performance. Unlike heart rate—which fluctuates due to temperature, dehydration, caffeine, and fatigue—or speed—which is heavily skewed by wind and hill gradient—mechanical power directly quantifies the rate of kinetic energy delivered to the pedals.
The Cycling Watts Power Output Estimator uses classical Newtonian mechanics to calculate total power requirements () by modeling aerodynamic drag (), gravitational climbing resistance (), tire rolling resistance (), and drivetrain friction losses ().
flowchart TD
    INPUTS["🚴 Input Athlete System Mass (kg), Speed (km/h), and Road Incline %"] --> GRAV["⛰️ Compute Gravity Resistance Power P_gravity = m × g × sin(theta) × v"]
    INPUTS --> AERO["💨 Compute Aerodynamic Drag Power P_aero = 0.5 × CdA × rho × v^3"]
    INPUTS --> ROLL["🛞 Compute Rolling Resistance Power P_roll = Crr × m × g × cos(theta) × v"]
    GRAV & AERO & ROLL --> TOTAL["⚡ Sum Resistance Forces & Account for 97% Drivetrain Efficiency"]
    TOTAL --> WKG["📊 Calculate Power Output (Watts) and Power-to-Weight Ratio (W/kg)"]
2. Core Definitions & Analogy
Simple Definition
A Cycling Power Estimator calculates how many Watts of energy your legs must produce to push you and your bicycle up a hill or down a flat road at a specific speed.
Technical Definition
Technically, cycling power is the rate of work done over time (), expressed in Joules per second (Watts). The total power required at the rear wheel equals the sum of resistive forces multiplied by forward velocity , divided by mechanical drivetrain efficiency :
The Locomotive Engine Analogy
Think of a cyclist like a steam locomotive climbing a mountain track. The weight of the train cars is system mass (), the steepness of the mountain pass is road grade (), and headwind is a counter-draft pushing against the front of the engine. The locomotive's boiler must generate enough steam pressure (Watts) to overcome all resistive forces combined. Dividing that steam output by train weight gives the power-to-weight ratio ().
3. History & Milestones
timeline
    title Evolution of Cycling Power Measurement Science
    1986 : SRM introduces the first strain-gauge crankset power meter for professional cycling.
    1998 : Powertap rear hub power meters make power data accessible to amateur cyclists.
    2011 : Dual-sided pedal power meters (Garmin Vector, Favero Assioma) hit the market.
    2020s : Virtual indoor cycling (Zwift) standardizes W/kg racing categories worldwide.
4. Core Concepts & Power-to-Weight Category Matrix
In competitive cycling, performance is categorized by Functional Threshold Power (FTP) normalized by body mass ():
| Rider Category | 5-Min Max Power (W/kg) | Functional Threshold Power FTP (W/kg) | 75 kg Rider 20-Min Power (Watts) | Typical Athletic Performance Level |
|---|---|---|---|---|
| WorldTour Pro Elite | Grand Tour General Classification contenders (Tour de France) | |||
| Category 1 / Semi-Pro | Elite national amateur champions, domestic pro racers | |||
| Category 3 / Advanced | Competitive club racers, strong sportive gran fondo finishers | |||
| Category 5 / Novice | Regular fitness cyclists, local group ride participants | |||
| Recreational / Beginner | Casual commuters, weekend leisure riders |
5. The Mathematical Model & Formulas
Total required mechanical power is the sum of four physical resistance components:
1. Gravitational Resistance Power ():
Where:
- = Combined mass of rider + bicycle + gear ()
- = Acceleration due to gravity ()
- = Road gradient incline slope as a decimal (e.g., $0.08$ for 8%)
- = Forward velocity in meters per second ()
2. Aerodynamic Drag Power ():
Where:
- $\rho$ = Air density ( at sea level at )
- = Drag coefficient frontal area ( in hoods position, in drops)
- = Headwind speed in
3. Rolling Resistance Power ():
Where is the coefficient of rolling resistance ( for premium clincher road tires).
4. Drivetrain Losses & Final Leg Power Output ():
6. Step-by-Step Computational Procedure
Consider an total system mass (rider + bike ) ascending an 8% mountain climb at a speed of in calm wind:
- Convert Velocity to Meters per Second:
- Compute Gravitational Incline Angle:
- Calculate Gravitational Power ():
- Calculate Aerodynamic Drag Power ( with ):
- Calculate Rolling Resistance Power ( with ):
- Sum Resistances and Apply 97.5% Drivetrain Efficiency:
- Compute Power-to-Weight Ratio (for 72 kg Rider):
7. Visual Explanations
Power Resistance Distribution on an 8% Incline
pie title Power Resistance Distribution when Climbing an 8 Percent Incline at 15 km/h
    "Gravity Resistance (85.2%)" : 85.2
    "Aerodynamic Air Drag (9.4%)" : 9.4
    "Tire Rolling Resistance (3.4%)" : 3.4
    "Drivetrain Mechanical Loss (2.0%)" : 2.0
8. Parameter Comparison Matrix
| Speed (km/h) | Road Incline Grade (%) | Rider + Bike Mass (kg) | Estimated Power (Watts) | Power-to-Weight (72 kg Rider) | Dominant Resistance Type |
|---|---|---|---|---|---|
| 30 km/h | 0% (Flat Road) | Aerodynamic Drag (82%) | |||
| 40 km/h | 0% (Flat Road) | Aerodynamic Drag (91%) | |||
| 12 km/h | 10% (Steep Hill) | Gravitational Climbing (88%) | |||
| 15 km/h | 8% (Moderate Hill) | Gravitational Climbing (85%) | |||
| 20 km/h | 6% (Alpine Pass) | Gravity (74%) + Aero (20%) |
9. Real-World Applications & Case Studies
- Aerodynamic vs. Weight Optimization: On flat roads above , aerodynamic drag accounts for over 85% of total resistance. Saving of aerodynamic drag ( reduction from to via aero handlebars and skin suits) saves at . On a steep 10% climb, saving of equipment mass saves .
- Case Study (Pacing an Alpine Pass): A cyclist targeting Alpe d'Huez ( at 8.1% average grade) used the power estimator to lock in a steady output. Rather than surging to on early hairpins, maintaining a constant pacing strategy prevented premature neuromuscular burnout, shaving 4 minutes off their personal best.
10. Advantages & Limitations
Advantages
- Allows accurate training intensity planning without purchasing expensive pedal power meters ($500+).
- Isolates physical fitness () from environmental factors like wind and slope.
- Enables precise caloric expenditure modeling ().
Limitations
- Wind Estimation Sensitivity: Headwinds significantly increase aerodynamic drag (). Estimations assume calm air unless anemometer data is supplied.
11. Common Pitfalls
Pitfall 1: Confusing Total System Mass with Rider Body Weight
Always add bicycle weight (), filled water bottles (), shoes, and clothing to your body weight when calculating total mass (). Omitting bike mass underestimates climbing power by 10% - 12%.
12. Frequently Asked Questions (FAQ)
Q: Why does power increase exponentially on flat ground?
A: Aerodynamic drag power scales with the cube of velocity (). Doubling your speed on a flat road requires 8 times more aerodynamic power!
Q: What is a good W/kg ratio for amateur cyclists?
A: A Functional Threshold Power of is a strong benchmark for competitive group rides, while represents an advanced amateur racer.
Q: How many calories do I burn per hour at 200 Watts?
A: At 200 Watts with typical human metabolic efficiency (22%), you burn approximately .
13. Expert Tips & Summary
- Adopt a Low Aerodynamic Position: Riding in the drops or aero tuck reduces by up to 20%, yielding "free speed" on flat and downhill sections.
- Keep Drivetrain Clean & Lubricated: A dirty, unlubricated chain increases drivetrain friction losses from 2.5% up to 6%, wasting .
- Summary: Calculating mechanical power () provides an objective, wind- and slope-adjusted benchmark for cycling performance mastery.
Additional Technical Guidelines & Measurement Standards
When conducting calculations for Cycling Watts Power Output Estimator, maintaining quantitative precision and verifying input parameter boundaries is essential for reliable scenario evaluation. Always verify that raw numerical inputs are measured using standardized instrumentation, and double-check unit conversions prior to applying outputs in commercial, industrial, or academic projects.
For quantitative unit conversions and scientific calculations, always maintain at least four decimal places of precision during intermediate arithmetic stages before rounding final results. When preparing technical reports, laboratory documentation, or financial forecasts, cross-verify all output variables against established international measurement standards (such as SI, NIST, and ISO metric benchmarks) to guarantee consistent analytical rigor across all computational workflows.
MathsLover.com delivers this interactive solver 100% free of charge to foster global mathematical literacy, educational accessibility, and data-driven problem solving across scientific, technical, and academic communities worldwide.