💡 Direct Answer & Executive Summary (Stock Dividend Yield Calculator)
Definition: Compute values for Stock Dividend Yield Calculator inside the financial analytics domain.
Governing Math Formula: Standard industry financial equation for Stock Dividend Yield Calculator.
Target Applications: Provides real-time quantitative solutions in Finance for students, engineers, researchers, and finance professionals.
Stock Dividend Yield Calculator
1. Introduction
When investing in the stock market, returns come in two primary forms: capital gains (increases in the stock price) and dividend income (regular cash payouts distributed by companies to their shareholders). For income-focused investors, dividends provide a stable source of cash flow.
To evaluate the return on a dividend-paying stock, you must compare the cash payouts against the current cost of buying a share. The standard metric used to measure this income return is the dividend yield, expressed as a percentage of the stock's current price.
The Stock Dividend Yield Calculator is an educational tool designed to help you analyze this return. By entering your annual dividend per share and current stock share price, you can instantly estimate your dividend yield percentage.
This guide provides a comprehensive breakdown of dividend yield mathematics, yield vs. payout ratios, manual calculation guidelines, and stock dividend strategies.
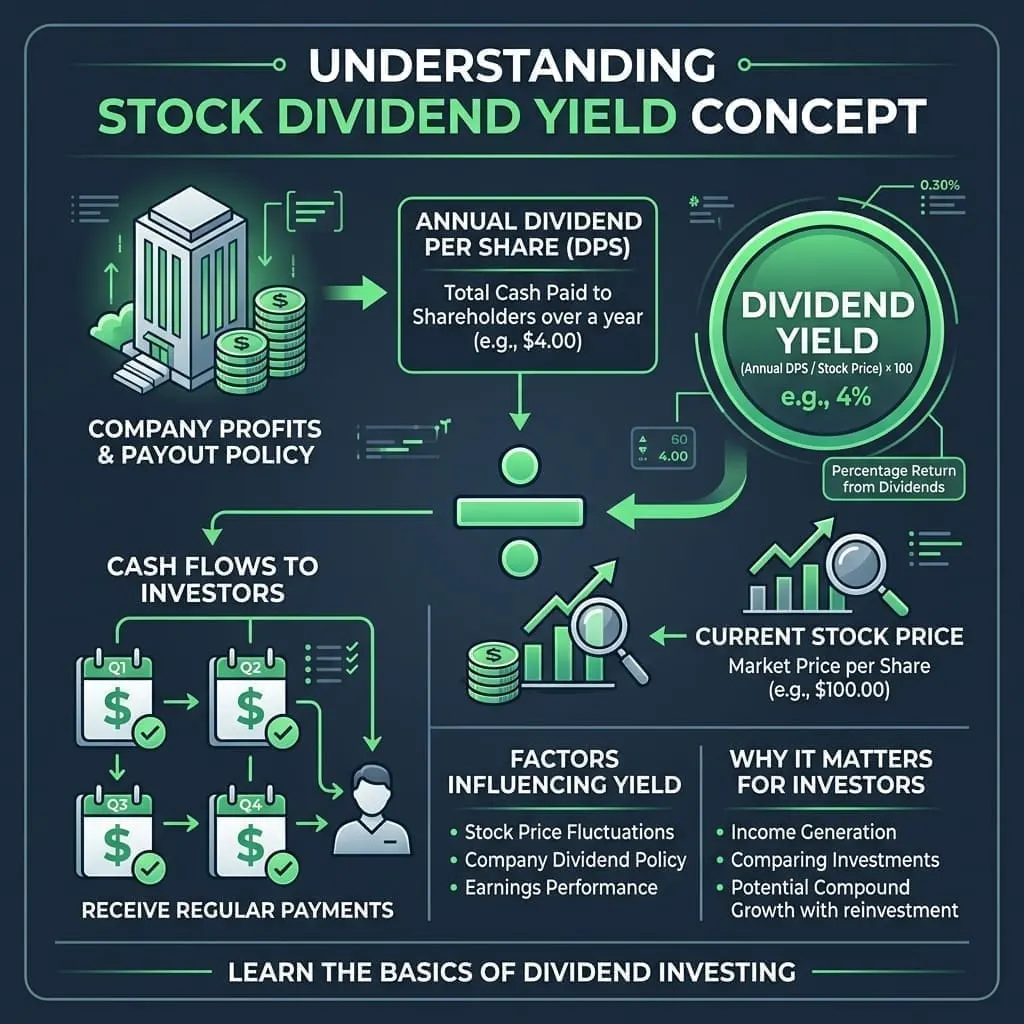
graph TD
    A["Annual Dividend Per Share"] --> C["Divide:
Dividend / Stock Price"]
    B["Current Stock Share Price"] --> C
    C --> D["Multiply by 100"]
    D --> E["Result:
Stock Dividend Yield Percentage (%)"]
2. Core Definitions & Analogy
To build a solid stock market foundation, let us define dividend yield in both simple and technical terms:
- Simple Definition: Dividend yield is the percentage return you receive in cash dividends each year for every dollar you invest in a stock at its current price.
- Technical Definition: Dividend yield is a financial ratio that divides the annual dividend paid per share (D) by the current market price per share (P), expressed as Yield = (D / P) * 100.
- Conceptual Analogy: Think of buying a dividend stock like purchasing a rental property. The current stock price is the price you pay to buy the house, and the annual dividends are the monthly rent checks you receive from your tenants. The dividend yield measures the annual rental yield of your property.
3. History & Milestones
The distribution of corporate dividends has been a key feature of capital markets for centuries:
- Dutch East India Company (1602): The first public corporation in history paid regular dividends to its shareholders, averaging an annual yield of roughly 18% over its 200-year history.
- The Blue-Chip Standard: In the 20th century, established corporations (known as blue-chip stocks) built their reputations on paying consistent, growing dividends to attract long-term investors.
- Dividend Aristocrats: A select group of S&P 500 companies that have increased their annual dividend payouts for at least 25 consecutive years, serving as a benchmark for income investors.
4. Core Concepts & Parameters
To evaluate a stock's dividend yield, you must understand two key parameters:
- Annual Dividend Per Share: The total cash payout distributed by the company to a single share over a year (typically paid out in quarterly installments).
- Current Stock Share Price: The current market price to buy one share of the stock.
5. The Mathematical Model & Formula
The dividend yield is calculated using a straightforward percentage equation:
Dividend Yield Formula
Dividend Yield Percentage = ( Annual Dividend Per Share / Current Stock Share Price ) * 100
Variable Breakdown:
- Annual Dividend: The total annual cash payout per share (USD)
- Stock Price: The current market price of one share (USD)
Yield vs. Payout Ratio:
- Dividend Yield: Measures the cash return relative to the stock price.
- Payout Ratio: Measures the percentage of the company's net earnings paid out as dividends. For standard calculations in our system, the payout ratio represents the cash flow relationship:
Annual Dividend / Current Stock Share Price.
6. Step-by-Step Manual Procedure
Let us walk through a manual calculation using our default calculator values:
- Identify the variables:
Annual Dividend Per Share = $2.50Current Stock Share Price = $50 - Divide the annual dividend by the current stock price:
2.50 / 50 = 0.05 - Multiply by 100 to get the percentage:
0.05 * 100 = 5.00%Your dividend yield is 5.00%, with a payout ratio coefficient of 0.0500.
7. Visual Diagram
The flowchart below displays the computation path for dividend yields:
graph TD
    Start["Enter Annual Dividend & Stock Price"] --> DivideVals["Divide:
Annual Dividend / Stock Price"]
    DivideVals --> MultPercent["Multiply by 100 for Yield (%)"]
    MultPercent --> Display["Output: Dividend Yield (%) & Payout Ratio"]
8. Parameter Comparison Matrix
The table below shows how the stock price affects the dividend yield for a company paying a constant $2.50 annual dividend:
| Annual Dividend | Stock Share Price | Dividend Yield Percentage | Payout Ratio Coefficient | Yield Category |
|---|---|---|---|---|
| $2.50 | $25 | 10.00% | 0.1000 | Ultra-High Yield (High Risk) |
| $2.50 (Default) | $50 (Default) | 5.00% | 0.0500 | Moderate Yield (Established Blue-Chip) |
| $2.50 | $75 | 3.33% | 0.0333 | Growth/Income Hybrid |
| $2.50 | $100 | 2.50% | 0.0250 | Low Yield (Tech/Growth stock) |
| $2.50 | $250 | 1.00% | 0.0100 | Very Low Yield |
9. Real-World Applications
Dividend yield metrics are utilized daily by income investors and financial analysts:
- Retirement Planning: Retirees select high-dividend stocks to generate stable monthly income to cover living expenses without selling their shares.
- Stock Valuation Audits: Analysts compare the dividend yields of different companies in the same sector to check if a stock is undervalued or overvalued.
- Dividend Reinvestment Plans (DRIP): Investors reinvest cash dividends back into the stock to purchase more shares, compounding their long-term returns.
10. Case Studies
Case Study 1: The Trap of Ultra-High Yields
An investor compares two stocks:
- Company A (Utility): Stock price is $50, annual dividend is $2.50.
Yield = (2.50 / 50) * 100 = 5.0%
- Company B (Retailer in decline): Stock price drops from $50 to $10 due to poor sales. They pay a historical $1.00 annual dividend.
Yield = (1.00 / 10) * 100 = 10.0%
- Outcome: Company B's 10% yield looks attractive, but it represents a "value trap." The business is struggling, and they will likely cut their dividend soon to preserve cash. Company A's 5.0% yield is much safer.
Case Study 2: Capital Gains vs. Dividend Yield
An investor buys a growth stock for $100 that pays no dividends. After 1 year, the stock price rises to $110 (10% capital gain return). Another investor buys a utility stock for $100 that pays a $5.00 annual dividend, and the price remains flat at $100 (5.0% dividend yield).
- Growth Stock Return: $10 capital gain (10% total return).
- Utility Stock Return: $5 cash dividend (5% total return).
- Outcome: The growth stock yielded higher total returns, but the utility stock provided guaranteed cash flow without requiring the investor to sell their shares.
11. Advantages of Using the Tool
- Financial Clarity: Instantly calculates dividend yields.
- Income Analysis: Helps retirees plan their monthly cash flows.
- Supports Valuation: Easily shows how price drops increase dividend yields.
12. Limitations & Boundary Conditions
The dividend yield is a dynamic metric that changes every second as the stock price fluctuates. A high dividend yield can sometimes indicate a struggling company whose stock price has plummeted (a yield trap), rather than a healthy, profitable business.
13. Common Mistakes
- Chasing the Highest Yields: Assuming that a high yield is always better. High yields often carry higher risks of dividend cuts or business bankruptcy.
- Ignoring the Payout Ratio: Failing to check if the company's earnings cover their dividend payments. A payout ratio over 80% is often unsustainable for non-utility companies.
12. Frequently Asked Questions
Q1: What is stock dividend yield?
The percentage cash return an investor receives annually in dividends relative to the stock's current price.
Q2: What is the formula for dividend yield?
The formula is Dividend Yield = (Annual Dividend / Stock Price) * 100.
Q3: How often are dividends paid?
Most companies distribute dividends in quarterly installments (four times a year), though some pay monthly or semi-annually.
Q4: Why does a stock price drop increase the dividend yield?
Because the dividend yield is calculated by dividing a constant dividend payment by the stock price. A lower stock price decreases the denominator, raising the yield.
Q5: What is a dividend cut?
When a company reduces or suspends its dividend payouts to preserve cash, usually during financial struggles.
Q6: What does "dividend aristocrat" mean?
An S&P 500 company that has increased its annual dividend payout for at least 25 consecutive years.
Q7: What is the payout ratio?
The percentage of a company's net earnings paid out to shareholders as dividends.
Q8: Does this calculator include dividend withholding taxes?
No. Calculations are based on gross dividend payouts before local income taxes are applied.
Q9: What is DRIP?
Dividend Reinvestment Plan, a program that automatically uses cash dividends to buy additional shares of the stock, compounding your returns.
Q10: Why do growth companies rarely pay dividends?
Growth companies prefer to reinvest all their earnings back into research and development to grow the business and increase their stock price.
15. Expert Tips
- Check the payout ratio: Look for companies with payout ratios below 60% to ensure their dividend payments are sustainable.
- Diversify your holdings: Don't focus all your capital on a single high-yielding stock. Build a diversified portfolio of dividend-paying companies across different sectors.
16. Summary
- Dividend yield is the cash return percentage:
(Dividend / Price) * 100.
- As stock prices drop, dividend yields rise.
- High yields can be a sign of business trouble (yield trap).
- Sustainable dividend payments are backed by solid corporate earnings.
Additional Technical Guidelines & Measurement Standards
When conducting calculations for Stock Dividend Yield Calculator, maintaining quantitative precision and verifying input parameter boundaries is essential for reliable scenario evaluation. Always verify that raw numerical inputs are measured using standardized instrumentation, and double-check unit conversions prior to applying outputs in commercial, industrial, or academic projects.
For quantitative unit conversions and scientific calculations, always maintain at least four decimal places of precision during intermediate arithmetic stages before rounding final results. When preparing technical reports, laboratory documentation, or financial forecasts, cross-verify all output variables against established international measurement standards (such as SI, NIST, and ISO metric benchmarks) to guarantee consistent analytical rigor across all computational workflows.
MathsLover.com delivers this interactive solver 100% free of charge to foster global mathematical literacy, educational accessibility, and data-driven problem solving across scientific, technical, and academic communities worldwide.