💡 Direct Answer & Executive Summary (Break-Even Point Revenue Calculator)
Definition: Determine sales unit volume needed to cover total fixed and variable business costs.
Governing Math Formula: Break-Even Units = Fixed Costs / (Price - Variable Cost).
Target Applications: Provides real-time quantitative solutions in Finance for students, engineers, researchers, and finance professionals.
Break-Even Point Revenue Calculator
1. Introduction
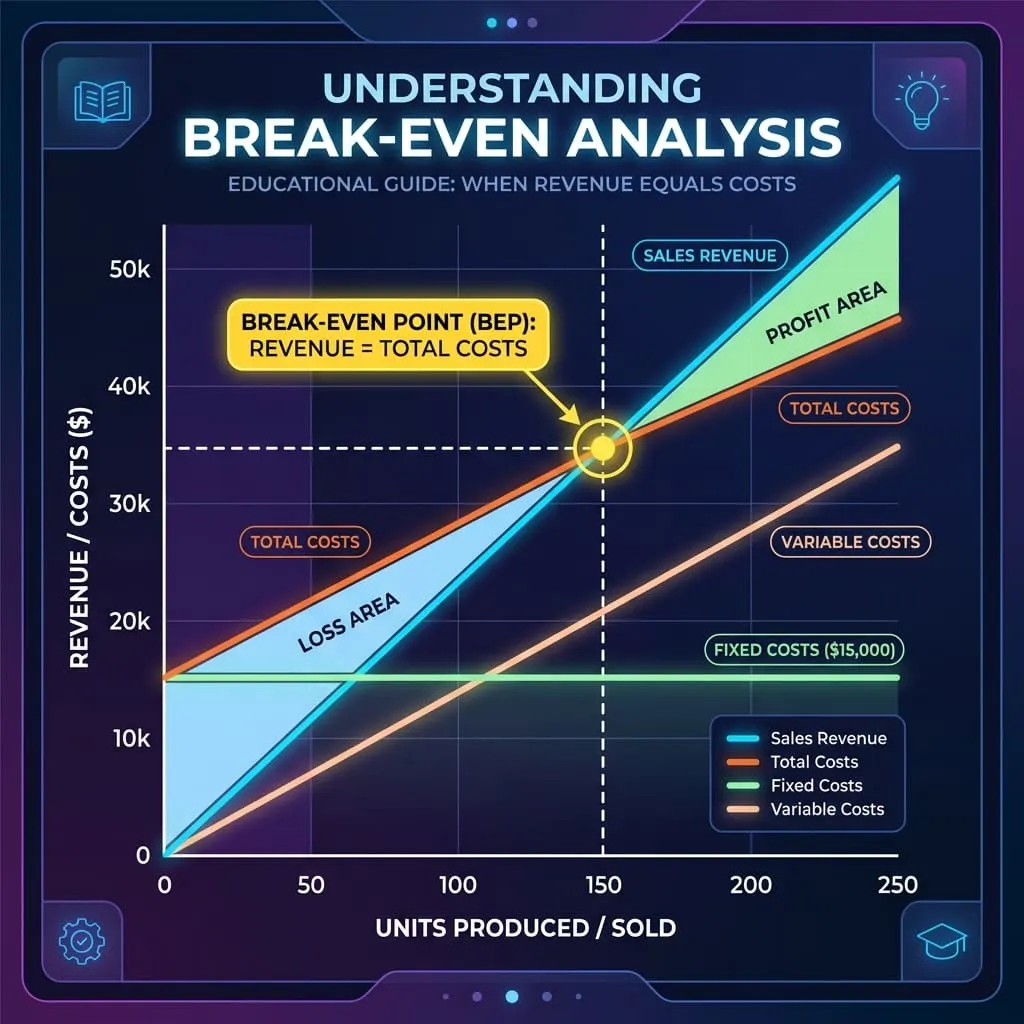
Starting and operating a business involves taking on financial risks. Before a company can turn a profit, it must cross a critical threshold: the break-even point. This is the moment when total sales revenue exactly equals total operating expenses, resulting in zero net profit and zero net loss.
Understanding your break-even point is essential for business viability. It tells you exactly how many product units you need to sell, or how much revenue you must generate, to cover your overheads. It acts as a baseline requirement, helping you set sales targets, price products, and evaluate business proposals.
The Break-Even Point Revenue Calculator is an educational tool designed to simplify this analysis. By entering your fixed operating costs, unit selling price, and unit variable cost, you can instantly estimate your break-even sales volume.
This guide provides a comprehensive breakdown of break-even mathematics, fixed vs. variable cost structures, manual calculation guides, and pricing strategies.
graph TD
    A["Fixed Operating Costs"] --> D["Calculate Contribution Margin: Price - Variable Cost"]
    B["Unit Selling Price"] --> D
    C["Unit Variable Cost"] --> D
    D --> E["Compute Break-Even Units: Fixed Costs / Margin"]
    E --> F["Result:
Minimum Sales Volume needed to Break Even"]
2. Core Definitions & Analogy
To build a solid business foundation, let us define break-even parameters in both simple and technical terms:
- Simple Definition: The break-even point is the exact number of sales needed so that your business does not lose money, covering all costs with zero profit.
- Technical Definition: The break-even point is the sales volume where total revenue equals total costs (fixed costs plus variable costs). It represents the intersection of the total revenue curve and the total cost curve, resulting in an operating income of zero.
- Conceptual Analogy: Think of operating a business like renting a booth at a weekend market. The booth rent is a flat fee (fixed cost) you pay regardless of sales. The ingredients for each item you sell represent your variable costs. Your first sales of the day go toward paying off the booth rent. Once you have sold enough items to cover that rent, you have broken even. Every sale after that is pure profit.
3. History & Milestones
The formalization of break-even analysis evolved during the Industrial Revolution as factories required structured cost controls:
- Industrial Costing (1800s): The shift from agricultural labor to large-scale factories required business owners to separate fixed building overheads from raw material costs.
- Walter Rautenstrauch (1930): An industrial engineering professor at Columbia University named Walter Rautenstrauch popularized the modern break-even chart, introducing it as a tool for corporate budgeting.
- Modern Managerial Accounting: Today, break-even analysis (also known as Cost-Volume-Profit, or CVP analysis) is a standard module in business education and corporate planning.
4. Core Concepts & Parameters
To evaluate your break-even point, you must understand three key parameters:
- Fixed Operating Costs: Expenses that do not change regardless of sales volume (e.g. rent, salaries, insurance, and equipment leases).
- Unit Selling Price: The price you charge customers for a single unit of your product or service.
- Unit Variable Cost: Direct costs that scale with sales volume (e.g. raw materials, packaging, and shipping fees for each unit sold).
5. The Mathematical Model & Formula
The break-even point is calculated using standard Cost-Volume-Profit (CVP) equations:
1. Contribution Margin Formula
Contribution Margin = Unit Selling Price - Unit Variable Cost
2. Break-Even Units Formula
Break-Even Units = Fixed Operating Costs / Contribution Margin
3. Break-Even Sales Revenue Formula
Break-Even Revenue = Break-Even Units * Unit Selling Price
Variable Breakdown:
- Fixed Costs: The total fixed operating costs (USD)
- Price: The unit selling price (USD)
- Variable Cost: The unit variable cost (USD)
Why the Formula Works:
The contribution margin represents the profit earned on each unit sold after covering its variable costs. This margin is used to pay down your fixed costs. Dividing total fixed costs by this unit margin tells you exactly how many sales are required to pay off your overheads.
6. Step-by-Step Manual Procedure
Let us walk through a manual calculation using our default calculator values:
- Identify the variables:
Fixed Operating Costs = $10,000Unit Selling Price = $50Unit Variable Cost = $20 - Calculate the Contribution Margin: Subtract variable cost from selling price.
Contribution Margin = 50 - 20 = $30Each sale contributes $30 toward covering your fixed costs. - Calculate the Break-Even Units: Divide fixed costs by the contribution margin.
Break-Even Units = 10,000 / 30 = 333.33You must sell 334 units (rounding up to the nearest whole unit) to cover your expenses. - Calculate the Break-Even Revenue: Multiply units by the selling price.
Break-Even Revenue = 334 * 50 = $16,700Your business must generate $16,700 in sales revenue to break even.
7. Visual Diagram
The flowchart below displays the computation path for break-even analysis:
graph TD
    Start["Enter Fixed Costs, Price, Variable Cost"] --> CalcMargin["Compute Contribution Margin: Price - Variable Cost"]
    CalcMargin --> CalcUnits["Compute Break-Even Units: Fixed Costs / Margin"]
    CalcUnits --> CalcRevenue["Compute Break-Even Revenue: Units * Price"]
    CalcRevenue --> Display["Output: Break-Even Units & Break-Even Revenue"]
8. Parameter Comparison Matrix
The table below shows how varying the selling price affects the break-even point for a business with $10,000 in fixed costs:
| Fixed Costs | Selling Price | Variable Cost | Contribution Margin | Break-Even Units | Break-Even Revenue |
|---|---|---|---|---|---|
| $10,000 | $30 | $20 | $10 | 1,000 Units | $30,000 |
| $10,000 | $40 | $20 | $20 | 500 Units | $20,000 |
| $10,000 (Default) | $50 (Default) | $20 (Default) | $30 | 334 Units | $16,700 |
| $10,000 | $70 | $20 | $50 | 200 Units | $14,000 |
| $10,000 | $120 | $20 | $100 | 100 Units | $12,000 |
9. Real-World Applications
Break-even analysis is utilized by founders, managers, and lenders across multiple business stages:
- Startup Viability Planning: Founders calculate the break-even point to decide if a business concept can realistically generate enough sales to survive.
- Pricing Adjustments: Managers run break-even scenarios to check if raising prices will reduce the volume of sales needed to remain profitable.
- Operating Overhead Audits: Businesses use calculations to check how taking on new fixed costs (like leasing a larger office) will raise their sales requirements.
10. Case Studies
Case Study 1: Launching a Custom T-Shirt Business
An entrepreneur wants to launch an online store selling custom t-shirts. * Fixed Costs: Website hosting, design software, and marketing totals $1,200 per month.
- Pricing: T-shirts sell for $25. Variable costs (printing, blank shirts, and packaging) are $10 per unit.
- Break-Even calculation: Contribution Margin = 25 - 10 = $15. Break-Even Units = 1,200 / 15 = 80 shirts per month.
- Outcome: The entrepreneur must sell at least 80 shirts monthly to cover costs, setting a clear target for their marketing campaigns.
Case Study 2: Upgrading Manufacturing Equipment
A bakery owner produces cakes with fixed operating costs of $6,000 per month. Cakes sell for $40, with variable costs of 25), requiring 240 sales to break even. The owner wants to lease a new automated mixer that adds $1,000 to monthly fixed costs but cuts variable costs to $10.
- New Costs: Fixed costs = 30.
- New Break-Even Units: 7,000 / 30 = 233.33 (234 cakes).
- Outcome: Leasing the equipment actually lowers the break-even point from 240 to 234 cakes, making the upgrade a viable business decision.
11. Advantages of Using the Tool
- Saves Time: Instantly calculates unit and revenue metrics in seconds.
- Supports Decisions: Helps you evaluate different pricing structures on the fly.
- Reduces Risk: Identifies unrealistic sales requirements before you launch.
12. Limitations & Boundary Conditions
This calculator assumes that the unit selling price and unit variable cost remain constant across all sales volumes. In the real world, variable costs often decrease at high volumes due to bulk material discounts, while selling prices may drop due to promotional discounts.
13. Common Mistakes
- Ignoring Variable Costs: Assuming that selling price minus fixed costs solves for profitability. Always subtract variable costs first to find your contribution margin.
- Classifying Variable Costs as Fixed: Mixing up raw material costs with fixed overheads will skew your break-even units.
12. Frequently Asked Questions
Q1: What is the break-even point?
The sales volume where total business revenue exactly equals total operating costs, resulting in zero profit and zero loss.
Q2: What is the formula for break-even units?
The formula is Break-Even Units = Fixed Costs / (Selling Price - Variable Cost).
Q3: What is the difference between fixed and variable costs?
Fixed costs remain constant regardless of sales volume (e.g. rent). Variable costs scale with sales volume (e.g. raw materials).
Q4: What is the contribution margin?
The selling price minus the unit variable cost, representing the profit from each sale that goes toward covering fixed costs.
Q5: How does raising prices affect the break-even point?
Raising prices increases the contribution margin, which reduces the number of sales needed to break even.
Q6: Can a business have a negative break-even point?
No. If variable costs exceed the selling price, the contribution margin is negative, meaning the business will lose money on every sale and can never break even.
Q7: What is break-even revenue?
The total dollar volume of sales required to cover all operating expenses.
Q8: Does this calculator include corporate taxes?
No. Calculations are based on operating costs before income taxes are applied.
Q9: Why is break-even analysis important for lenders?
Lenders review break-even metrics to check if a business can realistically generate enough sales to repay its loans.
Q10: How often should a business calculate its break-even point?
At least annually, or whenever product prices, material costs, or fixed overheads change.
15. Expert Tips
- Keep fixed costs low early on: When launching a startup, minimize fixed overheads (like leasing long-term offices) to keep your break-even point as low as possible.
- Track material price changes: Monitor your supply costs closely, as a small increase in variable costs raises your break-even sales requirements.
16. Summary
- The break-even point covers all costs with zero net profit or loss.
- The break-even formula is
Fixed Costs / (Selling Price - Variable Cost).
- Contribution margin is the unit selling price minus variable costs.
- Raising prices or lowering variable costs reduces your break-even target.
Additional Technical Guidelines & Measurement Standards
When conducting calculations for Break-Even Point Revenue Calculator, maintaining quantitative precision and verifying input parameter boundaries is essential for reliable scenario evaluation. Always verify that raw numerical inputs are measured using standardized instrumentation, and double-check unit conversions prior to applying outputs in commercial, industrial, or academic projects.
For quantitative unit conversions and scientific calculations, always maintain at least four decimal places of precision during intermediate arithmetic stages before rounding final results. When preparing technical reports, laboratory documentation, or financial forecasts, cross-verify all output variables against established international measurement standards (such as SI, NIST, and ISO metric benchmarks) to guarantee consistent analytical rigor across all computational workflows.
MathsLover.com delivers this interactive solver 100% free of charge to foster global mathematical literacy, educational accessibility, and data-driven problem solving across scientific, technical, and academic communities worldwide.