💡 Direct Answer & Executive Summary (Personal Water Footprint Calculator)
Definition: Environmental footprint computation: Personal Water Footprint Calculator.
Governing Math Formula: W_total = W_direct (Shower + Laundry + Tap) + W_indirect (Dietary Virtual Water)
Target Applications: Provides real-time quantitative solutions in Ecology for students, engineers, researchers, and finance professionals.
Personal Water Footprint Calculator: The Definitive Guide to Measuring Direct & Indirect Water Usage
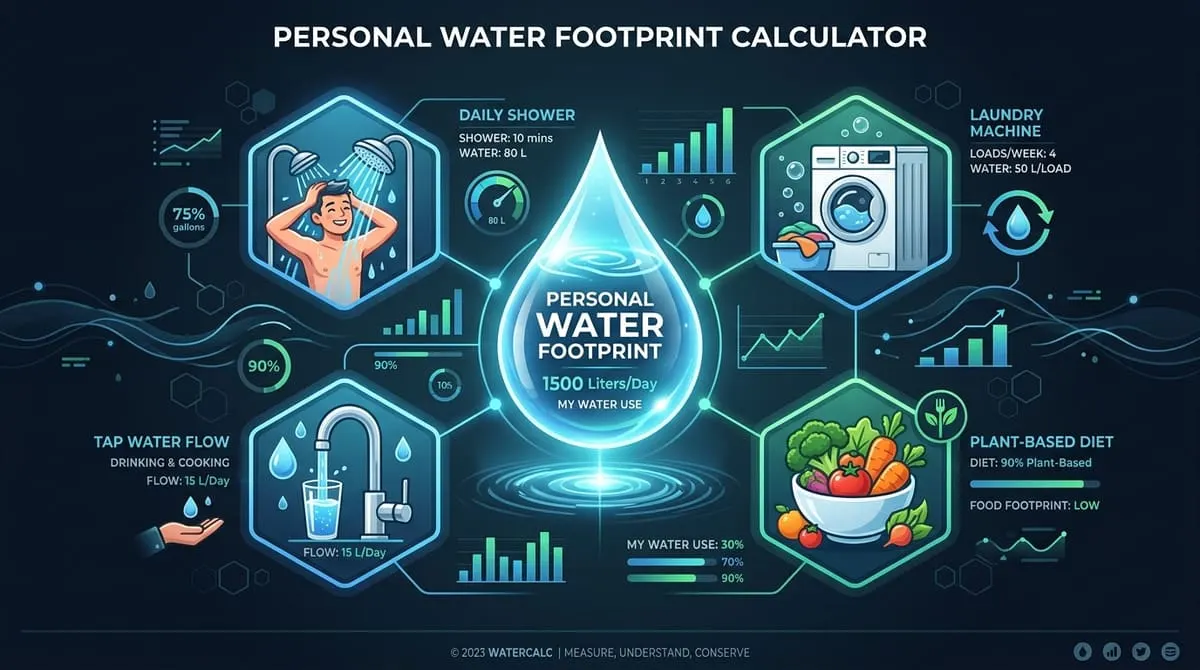
1. Introduction
Water is the fundamental molecule of human survival, economic growth, and ecological balance. Yet, while most people associate their personal water usage strictly with what flows from household taps—showering, brushing teeth, washing dishes, and watering lawns—this direct water consumption represents less than 10% of an individual's total environmental impact. The remaining 90% is hidden inside the food we eat, the clothes we wear, the energy we consume, and the manufactured products we buy every single day. This hidden volume is known as virtual (or embedded) water.
The Personal Water Footprint Calculator is a quantitative environmental modeling tool designed to measure, evaluate, and analyze an individual's total daily and annual freshwater consumption. By combining direct domestic water use with indirect virtual water coefficients derived from global supply chain research, this tool reveals the true volumetric impact your lifestyle exerts on Earth's finite freshwater reserves.
graph TD
    A[Individual Lifestyle] --> B[Direct Water Footprint]
    A --> C[Indirect / Virtual Water Footprint]

    B --> D[Showers & Bathing]
    B --> E[Laundry & Dishwashing]
    B --> F[Tap Water & Sanitation]

    C --> G[Dietary Intake - Meat, Dairy, Crops]
    C --> H[Consumer Goods - Apparel & Electronics]
    C --> I[Energy & Transportation Infrastructure]

    D & E & F & G & H & I --> J[Total Personal Water Footprint]
Why Water Footprint Matters Today
Freshwater accounts for only 2.5% of all water on Earth, and less than 1% of that total is accessible in lakes, rivers, and shallow aquifers. As global population growth, urbanization, and climate change intensify pressure on hydrological basins, over 4 billion people experience severe water scarcity for at least one month per year.
Understanding your personal water footprint is the first crucial step toward sustainable resource management. Whether you are a student exploring environmental science, a homeowner seeking to reduce utility bills, or a sustainability consultant auditing community consumption, this guide provides the mathematical formulas, historical context, step-by-step calculations, and actionable strategies needed to master personal water footprinting.
2. Core Definitions & Analogy
To fully comprehend personal water footprinting, it is helpful to explore the concept through three distinct lenses: simple intuitive language, formal technical definitions, and a practical everyday analogy.
Simple Definition
Your Personal Water Footprint is the total volume of fresh water used to produce the goods and services you consume, plus the water you use directly at home through taps, toilets, showers, and appliances.
Technical Definition
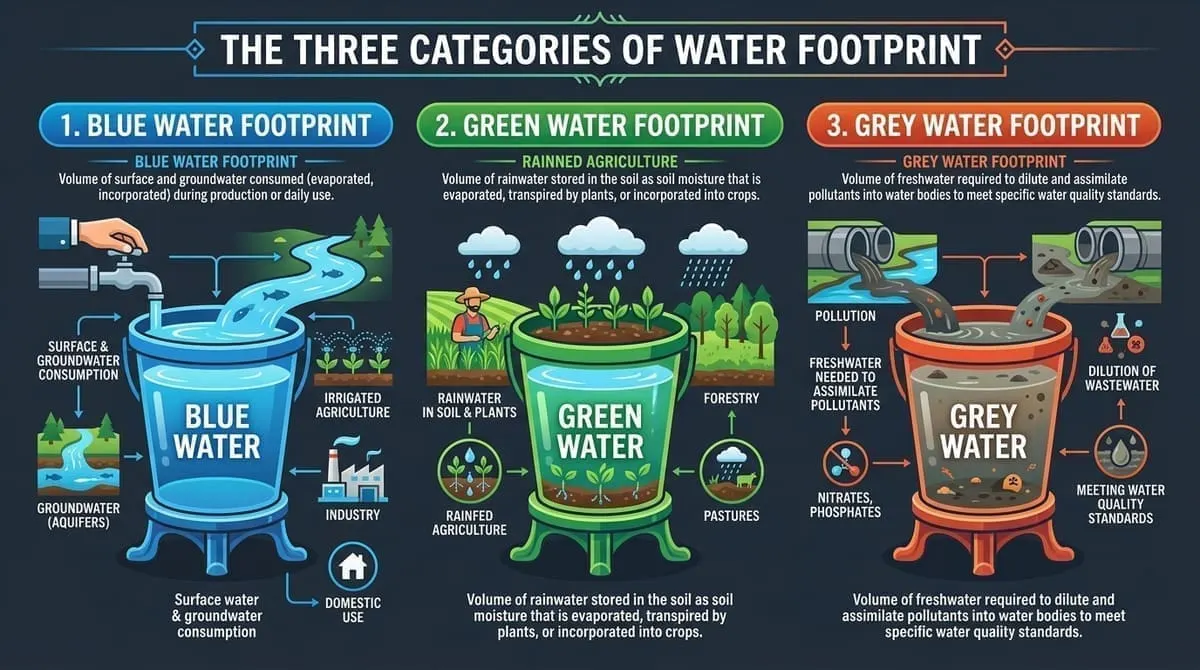
Technically, a water footprint is an empirical metric measuring multi-dimensional freshwater consumption (evaporated, incorporated, or polluted) expressed as a function of time and location. It is categorized into three distinct color-coded components established by the Water Footprint Network (WFN):
- Blue Water Footprint: The volume of surface water and groundwater consumed (evaporated or incorporated into products) as a result of an activity or domestic task.
- Green Water Footprint: The volume of rainwater stored in the soil as soil moisture that is transpired by crops, forests, and natural vegetation during agricultural production.
- Grey Water Footprint: The theoretical volume of freshwater required to assimilate and dilute pollutant loads (such as agricultural fertilizer run-off or domestic greywater) to meet ambient water quality standards.
Conceptual Analogy: The Water Bank Account
Imagine your personal finances. Your Direct Water Use is like the physical cash in your wallet—visible, tangible, and spent directly at the store (showering, drinking, washing).
Your Indirect (Virtual) Water Footprint is like the unseen digital transactions processing behind your bank account. When you purchase a leather jacket, a cup of coffee, or a hamburger, you aren't paying with physical gallons of water at the register, but thousands of gallons were spent upstream by farmers, livestock managers, and manufacturing plants to bring that product to your hands.
mindmap
  root((Personal Water Footprint))
    Direct Water Footprint
      Showers and Baths
      Laundry Loads
      Toilet Flushing
      Kitchen and Drinking
    Indirect Virtual Footprint
      Dietary Choices
        Beef and Pork
        Poultry and Eggs
        Grains and Vegetables
        Coffee and Tea
      Consumer Goods
        Cotton Clothing
        Footwear
        Paper Products
        Consumer Electronics
      Energy and Fuel
        Hydroelectric
        Thermoelectric Cooling
        Biofuels
3. History & Milestones
The conceptual framework of water footprinting evolved from trade economics and environmental engineering in response to growing global freshwater scarcity.
timeline
    title Evolution of Water Footprint Science
    1993 : Tony Allan conceptualizes "Virtual Water" to explain water-sparse Middle East trade dynamics.
    2002 : Professor Arjen Hoekstra introduces the formal "Water Footprint" accounting framework at UNESCO-IHE.
    2008 : Founding of the global Water Footprint Network (WFN) by Hoekstra, WWF, and international partners.
    2011 : WFN publishes "The Water Footprint Assessment Manual" (Global Standard).
    2014 : ISO 14046 standard published for corporate and product life-cycle water footprinting.
    2026 : Integration of real-time personal digital footprinting and IoT smart meter accounting.
Timeline of Key Milestones
- 1993 – The Invention of Virtual Water: Professor John Anthony (Tony) Allan introduced the term "Virtual Water" to describe how water-scarce nations in the Middle East avoided regional conflict by importing water-intensive food grains from water-abundant regions. (Allan received the Stockholm Water Prize in 2008 for this breakthrough).
- 2002 – The Birth of the Water Footprint: Professor Arjen Y. Hoekstra (1967–2019) at the UNESCO-IHE Institute for Water Education formally invented the Water Footprint concept. Hoekstra expanded virtual water beyond international trade into an individual, national, and supply-chain consumption metric.
- 2008 – Establishment of the Water Footprint Network (WFN): Founded by Professor Hoekstra alongside the World Wildlife Fund (WWF), UNESCO, and leading research institutions to establish standardized calculation methodologies.
- 2011 – The Global Water Footprint Standard: The WFN published The Water Footprint Assessment Manual, standardizing calculations for Blue, Green, and Grey water footprints worldwide.
- 2014 – ISO 14046 Standard: The International Organization for Standardization published ISO 14046, providing formal principles and requirements for life-cycle assessments (LCA) of products and organizations.
4. Core Concepts & Parameters
To accurately calculate your personal water footprint, the calculator processes both direct domestic usage metrics and indirect consumption parameters.
1. Direct Domestic Parameters
| Parameter | Symbol | Standard Unit | Baseline Value | Description |
|---|---|---|---|---|
| Shower Duration | minutes/day | 10 min | Time spent showering daily. Standard showerheads use ~2.5 GPM (9.5 L/min); low-flow models use ~1.5 GPM (5.7 L/min). | |
| Laundry Frequency | loads/week | 3 loads/week | Weekly washing machine cycles. Standard top-loaders use ~40 gal/load (150 L); high-efficiency front-loaders use ~15 gal/load (57 L). | |
| Tap & Sanitation Use | gallons/day | 15 gal/day | Daily water consumed through bathroom sinks, kitchen prep, dishwashing, and drinking. | |
| Lawn & Garden Irrigation | gallons/week | 100 gal/week | Outdoor watering for lawns, garden beds, and car washing. |
2. Indirect (Virtual Water) Parameters
| Diet / Product Category | Virtual Water Coefficient (Liters) | Imperial Equivalent | Ecological Rationale |
|---|---|---|---|
| 1 kg Beef (Bovine Meat) | 15,400 L / kg | 1,845 gal / lb | Heavy feed crop irrigation (green water), 3-year growth cycle, and processing. |
| 1 kg Pork | 6,000 L / kg | 720 gal / lb | Concentrated feed grain requirements. |
| 1 kg Poultry (Chicken) | 4,300 L / kg | 515 gal / lb | Lower feed conversion ratio than ruminants. |
| 1 kg Rice | 2,500 L / kg | 300 gal / lb | Flooded paddy field cultivation (blue & green water). |
| 1 Cup of Coffee (125 ml) | 140 L / cup | 37 gal / cup | High water requirements for growing and processing coffee beans. |
| 1 Cotton T-Shirt | 2,700 L / shirt | 713 gal / shirt | Intensive cotton crop irrigation and textile dyeing greywater. |
| 1 Pair of Denim Jeans | 8,000 L / pair | 2,110 gal / pair | High cotton biomass requirement and heavy wash dyeing processes. |
5. The Mathematical Model & Formulas
The mathematical model powering the Personal Water Footprint Calculator evaluates personal water consumption by summing direct daily residential volumes and indirect virtual water coefficients across dietary and lifestyle choices.
1. Direct Daily Water Footprint Formula
The total direct daily domestic water footprint (, in gallons or liters per day) is expressed as:
Where:
- = Daily shower duration (minutes/day)
- = Showerhead flow rate (default: or )
- = Weekly laundry frequency (loads/week)
- = Water volume per laundry load (default: or )
- = Daily kitchen and bathroom tap use (default: or )
- = Daily toilet flushing volume (, default: )
2. Indirect (Virtual) Daily Water Footprint Formula
The indirect daily virtual water footprint (, in gallons or liters per day) aggregates agricultural, dietary, and industrial supply chain virtual water factors:
Where dietary virtual water footprint () is calculated based on daily caloric and dietary composition coefficients:
Where:
- = Mass or quantity of food item consumed per day (kg/day or servings/day)
- = Virtual water intensity coefficient of food item (L/kg or gal/serving)
Average daily dietary virtual water footprints vary significantly by diet classification:
* Meat-Heavy (Omnivore): ()
* Average Balanced Diet: ()
* Vegetarian Diet: ()
* Vegan (Plant-Based): ()
3. Total Personal Water Footprint Formula
The total daily personal water footprint () combines direct and indirect contributions across the three ecological classifications:
To convert daily total footprint to annual personal water footprint ():
6. Step-by-Step Computational Procedure
Follow this manual computational procedure to calculate your personal daily water footprint without an automated computer solver.
Example Scenario Parameters
- Person: Alex (Urban resident, moderate meat consumer)
- Daily Shower Duration: at standard flow rate.
- Weekly Laundry: using a top-loader ().
- Daily Tap & Dishwashing: .
- Diet: Average Balanced Omnivore Diet ( virtual water).
- Weekly Apparel/Goods Shopping: Equivalent to virtual industrial water.
graph LR
    Step1[1. Calculate Shower Vol] --> Step2[2. Normalize Laundry Vol]
    Step2 --> Step3[3. Sum Direct Domestic Vol]
    Step3 --> Step4[4. Add Dietary & Goods Virtual Vol]
    Step4 --> Step5[5. Compute Annual Total]
Calculation Steps
Step 1: Compute Daily Shower Water Volume
Step 2: Compute Daily Laundry Water Volume
Step 3: Compute Total Direct Domestic Footprint ()
Step 4: Compute Total Indirect Virtual Footprint ()
Step 5: Compute Total Personal Water Footprint ()
Step 6: Compute Annual Personal Water Footprint ()
7. Visual Explanations
Direct vs. Indirect Footprint Distribution
The breakdown below illustrates the stark disproportion between direct household tap usage and hidden virtual water consumption in a typical individual's lifestyle:
pie title Personal Water Footprint Distribution (%)
    "Dietary Intake (Virtual Water)" : 68
    "Consumer Goods & Apparel" : 20
    "Direct Showers & Bathing" : 6
    "Direct Laundry & Cleaning" : 4
    "Tap Water & Drinking" : 2
8. Parameter Comparison Matrix
The table below illustrates how changing key habits impacts an individual's daily and annual water footprint across three lifestyle profiles:
| Lifestyle Profile | Daily Shower (min) | Shower Flow Rate (GPM) | Laundry (loads/wk) | Dietary Pattern | Direct Footprint (gal/day) | Virtual Footprint (gal/day) | Total Footprint (gal/day) | Annual Total Footprint (gal/year) |
|---|---|---|---|---|---|---|---|---|
| High-Consumption Lifestyle | 20 min | 3.5 GPM | 7 loads | Heavy Beef / High Processed | 120 gal | 1,400 gal | 1,520 gal | 555,180 gal |
| Average Baseline | 10 min | 2.5 GPM | 3 loads | Balanced Omnivore | 55 gal | 845 gal | 900 gal | 328,725 gal |
| Eco-Conscious / Conservationist | 5 min | 1.5 GPM | 1.5 loads | Vegan / Plant-Based | 22 gal | 396 gal | 418 gal | 152,675 gal |
9. Real-World Applications
Personal water footprint metrics are utilized across multiple sectors in environmental engineering, governance, education, and municipal planning.
flowchart TD
    A[Personal Water Footprint Data] --> B[Municipal Water Utilities]
    A --> C[Corporate ESG & Supply Chain]
    A --> D[Educational Institutions]
    A --> E[Personal Household Budgeting]

    B --> B1[Demand Forecasting & Drought Rationing]
    C --> C1[ISO 14046 Product Audits]
    D --> D1[Environmental Literacy Programs]
E --> E1[Utility Bill & Resource Reduction]- Municipal Demand Forecasting: Public water utility boards analyze per capita direct water footprints to size municipal reservoirs, design tiered water rates, and establish emergency drought restrictions.
- Corporate ESG & Product Labeling: Multi-national companies audit product life-cycle water footprints under ISO 14046 to publish Environmental, Social, and Governance (ESG) transparency reports.
- Agricultural Policy & Virtual Water Trade: Nations experiencing water scarcity leverage trade policies to import water-intensive feed crops (virtual water import) while conserving domestic Blue and Green groundwater reserves for drinking and high-value agriculture.
- Individual Household Optimization: Homeowners track water footprints to target high-yield conservation investments—such as switching to low-flow fixtures or adopting low-water diets—maximizing ecological savings per dollar spent.
10. Case Studies & Scenarios
Case Study 1: The Impact of Dietary Transition on Virtual Water Footprint
Background: Sarah, a 32-year-old software engineer living in Denver, Colorado, wanted to minimize her environmental footprint. She initially focused on reducing her daily shower time from 12 minutes to 6 minutes, saving approximately 15 gallons of direct water per day ().
Intervention: After learning that virtual dietary water accounts for the vast majority of her footprint, Sarah transitioned from a beef-heavy omnivore diet to a flexitarian, predominantly plant-based diet (limiting meat to once a week).
graph TD
    Sub1[Shower Reduction: -15 gal/day] --> Savings1[Direct Annual Savings: 5,475 Gallons]
    Sub2[Dietary Transition: -450 gal/day] --> Savings2[Virtual Annual Savings: 164,362 Gallons]

    Savings1 & Savings2 --> NetTotal[Total Combined Savings: 169,837 Gallons/Year]
Results: * Direct Water Saved:
- Virtual Water Saved:
- Key Takeaway: Sarah's dietary shift yielded over 30 times more water savings than her shower reduction effort alone.
Case Study 2: Residential Water Audit & Low-Flow Retrofit
Background: A family of four in Austin, Texas underwent a home energy and water audit. Their initial direct water usage averaged ().
Retrofit Action Plan: 1. Replaced three standard showerheads () with WaterSense certified aerated heads (). 2. Installed dual-flush toilets () replacing older models. 3. Repaired a slow leaking toilet tank ( waste).
gantt
    title Family Residential Retrofit Water Savings
    dateFormat  YYYY-MM-DD
    section Baseline
    High Flow Baseline (280 gal/day) :done, b1, 2026-01-01, 2026-01-15
    section Retrofits
    Low Flow Showerheads (-40 gal/day) :active, r1, 2026-01-15, 2026-02-01
    Dual Flush Toilets (-48 gal/day) :active, r2, 2026-01-15, 2026-02-01
    Toilet Leak Repair (-20 gal/day) :active, r3, 2026-01-15, 2026-02-01
    section Optimized
    Post-Retrofit Baseline (172 gal/day) :crit, o1, 2026-02-01, 2026-03-01
Financial & Environmental Yield: * Daily Direct Savings: (38.5% reduction in direct water use).
- Annual Water Saved: .
- Annual Utility Bill Savings: $\$485\text{/year}$ in combined municipal water and sewer charges, achieving full payback on retrofit hardware in less than 9 months.
11. Advantages
Utilizing a Personal Water Footprint Calculator provides several key benefits:
- Complete Holistic Visibility: Reveals hidden virtual water consumption in food and manufactured goods that traditional water utility bills ignore.
- Targeted Environmental Action: Empowers users to prioritize high-impact behavioral changes (such as dietary adjustments) rather than focusing solely on minor direct reductions.
- Financial Savings: Reducing direct hot water consumption lowers municipal water, sewer, and gas/electric water heating energy bills simultaneously.
- Educational Value: Helps students and researchers understand complex agricultural and industrial supply chain dynamics through tangible metrics.
12. Limitations & Boundary Conditions
While the personal water footprint concept is a powerful educational tool, users must be aware of inherent mathematical boundary conditions:
- Regional Variance of Virtual Coefficients: The virtual water content of agricultural crops depends heavily on local climate, irrigation efficiency, and soil conditions. For instance, growing 1 kg of avocado in rain-abundant regions requires minimal Blue irrigation water, whereas growing the same crop in arid desert regions demands heavy Blue groundwater extraction.
- Qualitative vs. Volumetric Impact: A gallon of Blue water extracted from a severely depleted desert aquifer (e.g., California's Central Valley or the Ogallala Aquifer) exerts far higher ecological stress than a gallon of Green rainwater used in a humid forest, yet standard volumetric metrics treat them equally.
- Data Averaging in Manufactured Goods: Virtual water metrics for complex consumer electronics (like smartphones or automobiles) rely on industry-wide life-cycle averages rather than exact factory supply chain tracking.
11. Common Pitfalls
When calculating personal water footprints, beginners frequently make several common mistakes:
Pitfall 1: Ignoring Virtual Water in Food
Focusing exclusively on shower duration and tap usage while maintaining a high-beef diet leads to a vast underestimation of your true water footprint.
Pitfall 2: Confusing Water Withdrawal with Water Consumption
Water withdrawal refers to water taken from a source and returned to the same watershed after use (e.g. cooling water). Water consumption (which footprinting measures) refers to water that evaporates, is incorporated into products, or becomes polluted.
Pitfall 3: Assuming Standard Showerhead Flow Rates
Assuming your showerhead uses when you have a low-flow fixture (or an un-aerated high-flow fixture) will skew your direct footprint calculations by up to 60%.
12. Frequently Asked Questions (FAQ)
Q: What is the average personal water footprint worldwide?
A: The global average personal water footprint is approximately 3,800 Liters per day ( or ). However, per capita footprints vary drastically by region: the average US resident consumes (), whereas residents in developing nations may consume under .
Q: Why does beef have such a massive virtual water footprint (15,400 L/kg)?
A: Cattle require roughly 3 years to reach market weight, consuming thousands of kilograms of feed crops (corn, soy, pasture grass) over their lifetime. Millions of liters of Green and Blue water are evaporated to irrigate those feed crops, plus direct drinking water and processing facility washing.
Q: Does drinking bottled water significantly increase my personal water footprint?
A: Yes. Beyond the 0.5 Liters of drinking water inside the bottle, manufacturing the plastic (PET) bottle and industrial processing requires up to 3 Liters of virtual water per bottle, representing a 600% water footprint overhead compared to drinking tap water.
Q: What is the difference between Blue, Green, and Grey water?
A: Blue water comes from surface lakes, rivers, and underground aquifers; Green water is natural rainwater stored in soil moisture used by plants; Grey water is the freshwater volume needed to dilute pollutants generated during production to safe legal thresholds.
Q: How much water can I save by reducing my shower by 5 minutes?
A: With a standard showerhead, shortening your shower by 5 minutes saves 12.5 gallons per day () of direct high-grade drinking water.
Q: Does recycling paper and clothes help save water?
A: Absolutely. Manufacturing 1 ton of virgin paper requires up to of water, whereas recycled paper reduces water consumption by over 60%. Reusing or buying secondhand cotton apparel saves up to of virtual water per t-shirt.
Q: How does electricity generation contribute to my water footprint?
A: Thermoelectric power plants (coal, nuclear, natural gas) use massive volumes of cooling water evaporated during steam turbine power generation. Hydroelectric dams also evaporate vast surface volumes from reservoirs. Using energy-efficient appliances reduces your indirect energy water footprint.
Q: Is a vegan diet always lower in water footprint than an omnivore diet?
A: In over 95% of cases, yes. However, a vegan diet heavily reliant on water-intensive tree nuts (like almonds grown in drought-prone regions) can have a higher Blue water footprint than a vegetarian diet rich in rain-fed local grains.
Q: How accurate are personal water footprint calculators?
A: Direct water footprint calculations are highly accurate () when exact flow rates and times are known. Indirect virtual water metrics represent reliable regional scientific averages () based on life-cycle assessment (LCA) database benchmarks.
Q: What is the single most effective way to lower my total personal water footprint?
A: Reducing your consumption of ruminant livestock meat (beef and lamb) and minimizing food waste yields the largest quantitative reduction in personal water footprint.
Q: How does food waste impact water footprints?
A: Approximately 25% of all global freshwater used in agriculture is lost or wasted in uneaten food. Throwing away 1 lb of beef wastes 1,845 gallons of virtual water spent growing that food.
Q: Can I run this calculator offline in my browser?
A: Yes! The calculator is built entirely in client-side JavaScript, ensuring fast, private, offline execution without sending your numerical habit data to external servers.
15. Expert Tips & Best Practices
- Install WaterSense Low-Flow Aerators: Retrofitting bathroom taps with aerators and showerheads with models instantly cuts direct bathing water consumption by 40% without compromising water pressure.
- Adopt "Meatless Mondays": Substituting beef with legumes or plant-based proteins just one day a week saves up to of virtual water per year.
- Audit Household Toilet Tanks: Place a few drops of food coloring in your toilet tank. If color leaks into the bowl without flushing within 15 minutes, you have a flapper leak wasting up to .
- Run Full Appliance Loads Only: Always operate dishwashers and washing machines at full capacity to maximize volumetric efficiency per load.
- Harvest Rainwater for Outdoor Irrigation: Install a rain barrel connected to roof gutters to capture Green/Blue rainwater runoff for garden irrigation, reducing municipal tap draw.
16. Summary of Key Takeaways
- Direct vs. Indirect Split: Direct household tap water accounts for less than 10% of your personal water footprint; hidden virtual water in food, apparel, and energy accounts for over 90%.
- The Three Colors: Water footprints are categorized into Blue (lakes/aquifers), Green (rainwater/soil), and Grey (pollutant dilution volume).
- Diet Matters Most: Agricultural feed crop requirements make diet the single largest driver of an individual's total water footprint.
- Holistic Conservation: True water stewardship requires pairing household fixture retrofits with mindful food and consumer goods purchasing choices.
Additional Technical Guidelines & Measurement Standards
When conducting calculations for Personal Water Footprint Calculator, maintaining quantitative precision and verifying input parameter boundaries is essential for reliable scenario evaluation. Always verify that raw numerical inputs are measured using standardized instrumentation, and double-check unit conversions prior to applying outputs in commercial, industrial, or academic projects.
For quantitative unit conversions and scientific calculations, always maintain at least four decimal places of precision during intermediate arithmetic stages before rounding final results. When preparing technical reports, laboratory documentation, or financial forecasts, cross-verify all output variables against established international measurement standards (such as SI, NIST, and ISO metric benchmarks) to guarantee consistent analytical rigor across all computational workflows.
MathsLover.com delivers this interactive solver 100% free of charge to foster global mathematical literacy, educational accessibility, and data-driven problem solving across scientific, technical, and academic communities worldwide.