💡 Direct Answer & Executive Summary (Punnett Square genetics probability Calculator)
Definition: Predict offspring genotypic and phenotypic probability distributions, carrier risk percentages, and Mendelian inheritance ratios from maternal and paternal alleles.
Governing Math Formula: Mendel's Law of Segregation: Maternal alleles (A₁, A₂) × Paternal alleles (a₁, a₂) form 4 equal quadrants in a 2×2 Punnett matrix, yielding genotypic ratios (BB : Bb : bb) and phenotypic ratios (Dominant : Recessive).
Target Applications: Provides real-time quantitative solutions in Biology for students, engineers, researchers, and finance professionals.
Punnett Square Genetics Probability Calculator: Mendelian Alleles & Inheritance Guide
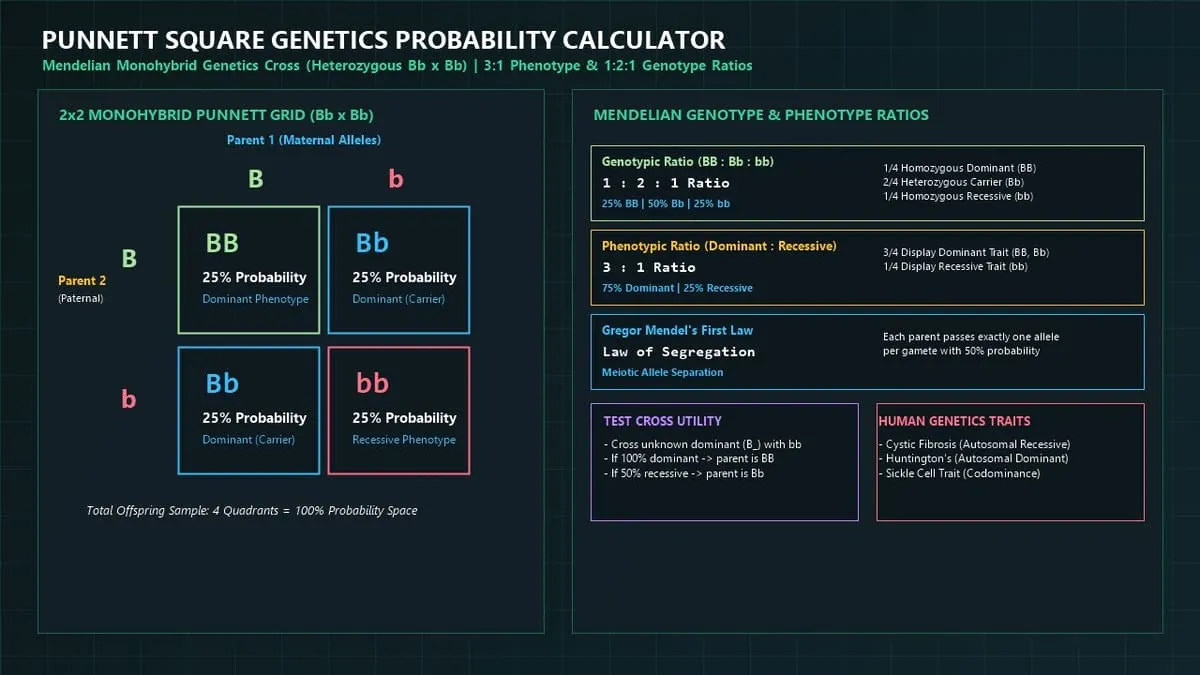
1. Introduction
How do genetic traits pass from parents to offspring? Why can two brown-eyed parents have a blue-eyed child, or two healthy carriers give birth to an infant with cystic fibrosis?
Devised in 1905 by English geneticist Reginald C. Punnett, the Punnett Square is the foundational visual and mathematical matrix used in biology and medicine to predict the probability of offspring inheriting specific genotypes and phenotypes under Mendelian laws of inheritance.
graph LR
    P1["👩 Parent 1 (Maternal)
e.g. Heterozygous Bb"] --> CROSS_ENG["🧬 Mendelian 2x2 Matrix Engine
Law of Segregation (Meiosis)
Quadrants = {BB, Bb, Bb, bb}"]
    P2["👨 Parent 2 (Paternal)
e.g. Heterozygous Bb"] --> CROSS_ENG
    CROSS_ENG --> PHENO_OUT["🔬 Phenotype Ratio: 3:1 (75% Dominant vs 25% Recessive)"]
    CROSS_ENG --> GENO_OUT["📊 Genotype Ratio: 1:2:1 (25% BB : 50% Bb : 25% bb)"]
    CROSS_ENG --> CARRIER_OUT["🩺 Carrier Risk Assessment: 50% Heterozygous Carriers"]
Mastering Punnett square genetics enables students, genetic counselors, plant breeders, and medical geneticists to:
- Predict offspring genotype probabilities for monohybrid (single gene) and dihybrid crosses.
- Calculate carrier risks for autosomal recessive genetic disorders (Cystic Fibrosis, Sickle Cell Anemia, Tay-Sachs).
- Assess dominant inheritance patterns (Huntington's Disease, Polydactyly, Marfan Syndrome).
- Understand Gregor Mendel's Law of Segregation and Law of Independent Assortment.
2. Definitions & Biological Formulations
2.1 The Simple Definition
- Gene: A sequence of DNA nucleotides encoding a specific biological protein or trait.
- Allele: A variant form of a given gene. Usually represented by letters:- Dominant Allele (): Expresses its trait whenever at least one copy is present ( or ).- Recessive Allele (): Only expresses its trait when homozygous ().
- Genotype: The underlying genetic allele combination (, , or ).
- Phenotype: The observable physical or physiological trait (e.g., Brown Eyes vs. Blue Eyes).
- Homozygous: Possessing two identical alleles ( = Homozygous Dominant, = Homozygous Recessive).
- Heterozygous: Possessing two different alleles ( = Heterozygous Carrier).
2.2 Formal Mathematical Formulations
1. Mendel's Law of Segregation (Meiotic Gamete Formation)
During meiosis (anaphase I & II), diploid () parent allele pairs separate so that each haploid () gamete receives exactly one allele with equal probability:
2. The Monohybrid Probability Matrix ()
For maternal alleles and paternal alleles , the joint probability of each quadrant $(i, j)$ is:
3. Classical Heterozygous Cross ()
- Genotypic Ratio:
- Phenotypic Ratio:
flowchart TD
    START["Input Parent 1 Genotype (Maternal) & Parent 2 (Paternal)"] --> SEGREGATE["Segregate Alleles during Meiosis:
Parent 1: [A1, A2] | Parent 2: [B1, B2]"]
    SEGREGATE --> MATRIX["Compute 4 Offspring Quadrants:
Q1 = A1+B1 | Q2 = A1+B2
Q3 = A2+B1 | Q4 = A2+B2"]
    MATRIX --> COUNT["Count Genotypes:
Count(BB), Count(Bb), Count(bb)"]
    COUNT --> PROBS["Calculate Probability Percentages:
% BB = (Count_BB / 4) × 100
% Bb = (Count_Bb / 4) × 100
% bb = (Count_bb / 4) × 100"]
    PROBS --> RATIOS["Derive Ratios:
Genotypic: Count_BB : Count_Bb : Count_bb
Phenotypic: Dominant(BB+Bb) : Recessive(bb)"]
    RATIOS --> DISPLAY["Display Punnett Grid, Phenotypic Split & Carrier Statistics"]
3. Master Monohybrid Cross Outcomes Table
| Cross Type | Maternal Genotype | Paternal Genotype | Offspring Genotypic Ratio | Offspring Phenotypic Ratio | Clinical / Agricultural Example |
|---|---|---|---|---|---|
| Heterozygous Cross | $1 BB : 2 Bb : 1 bb$ | Two Cystic Fibrosis carriers () | |||
| Testcross (Hetero Rec) | $2 Bb : 2 bb$ | Determining if dominant organism is carrier | |||
| Homo Dom Recessive | Mendel's F1 generation pea plant cross | ||||
| Homo Dom Hetero | $2 BB : 2 Bb$ | , | |||
| Homo Rec Homo Rec | Purebred recessive breeding lines |
4. Real-World Applications in Human Medical Genetics
graph TD
    MED_GEN["🩺 Clinical Genetic Counseling"] --> RECESSIVE["🧬 Autosomal Recessive Disorders
- Cystic Fibrosis (CFTR Gene)
- Sickle Cell Anemia (HBB Gene)
- 25% Affected Risk when both parents are carriers"]
    MED_GEN --> DOMINANT["⚠️ Autosomal Dominant Disorders
- Huntington's Chorea (HTT Gene)
- Polydactyly (Extra Fingers/Toes)
- 50% Transmission Risk if one parent is heterozygous"]
    MED_GEN --> AGRICULTURE["🌱 Agricultural Crop Breeding
- Disease resistance hybridization
- Yield and drought tolerance selection"]
5. Step-by-Step Practical Walkthrough
Problem: Genetic Risk Assessment for Cystic Fibrosis Carrier Couple
- Condition: Cystic Fibrosis (Autosomal Recessive: , ).
- Mother: Heterozygous Carrier ().
- Father: Heterozygous Carrier ().
Step-by-Step Execution:
- List Maternal Gametes: , .
- List Paternal Gametes: , .
- Populate 2x2 Punnett Matrix:- Quadrant 1 (Top-Left): Unaffected Non-Carrier- Quadrant 2 (Top-Right): Healthy Carrier- Quadrant 3 (Bottom-Left): Healthy Carrier- Quadrant 4 (Bottom-Right): Affected with Cystic Fibrosis
- Clinical Summary:- Chance child has Cystic Fibrosis (): 25% (1 in 4)- Chance child is healthy carrier (): 50% (1 in 2)- Chance child is completely unaffected (): 25% (1 in 4)- Total chance child is physically healthy ($NN + Nc$): 75% (3 in 4)
6. Frequently Asked Questions (FAQ)
What is a Punnett square?
A Punnett square is a diagram named after Reginald C. Punnett that visualizes all possible allele combinations resulting from a genetic cross between two parents.
What is the difference between a genotype and a phenotype?
A genotype is the exact genetic allele composition (, , or ), whereas a phenotype is the observable physical trait expressed (e.g., purple flowers vs. white flowers).
Can two parents with dominant traits have a child with a recessive condition?
Yes. If both parents are heterozygous carriers (), there is a with each pregnancy that the child will inherit both recessive alleles ().
What is a testcross?
A testcross is an experimental cross between an individual exhibiting a dominant phenotype (unknown genotype ) and a known homozygous recessive individual (). If any offspring exhibit the recessive phenotype, the parent was heterozygous ().
7. Summary Checklist
- ✔ Select Parent 1 Genotype: Choose , , or .
- ✔ Select Parent 2 Genotype: Choose , , or .
- ✔ Review 2x2 Offspring Matrix: Inspect 4 quadrant combinations.
- ✔ Analyze Genotypic Ratios: Review $1:2:1$ probability splits.
- ✔ Inspect Phenotypic Expression: Check dominant vs. recessive ratio.
Additional Technical Guidelines & Measurement Standards
When conducting calculations for Punnett Square genetics probability Calculator, maintaining quantitative precision and verifying input parameter boundaries is essential for reliable scenario evaluation. Always verify that raw numerical inputs are measured using standardized instrumentation, and double-check unit conversions prior to applying outputs in commercial, industrial, or academic projects.
For quantitative unit conversions and scientific calculations, always maintain at least four decimal places of precision during intermediate arithmetic stages before rounding final results. When preparing technical reports, laboratory documentation, or financial forecasts, cross-verify all output variables against established international measurement standards (such as SI, NIST, and ISO metric benchmarks) to guarantee consistent analytical rigor across all computational workflows.
MathsLover.com delivers this interactive solver 100% free of charge to foster global mathematical literacy, educational accessibility, and data-driven problem solving across scientific, technical, and academic communities worldwide.