💡 Direct Answer & Executive Summary (Plant Transpiration Water Loss Solver)
Definition: Calculate plant transpirational water loss, stomatal conductance (gs), Vapor Pressure Deficit (VPD), canopy evapotranspiration, and water potential gradients (Ψ).
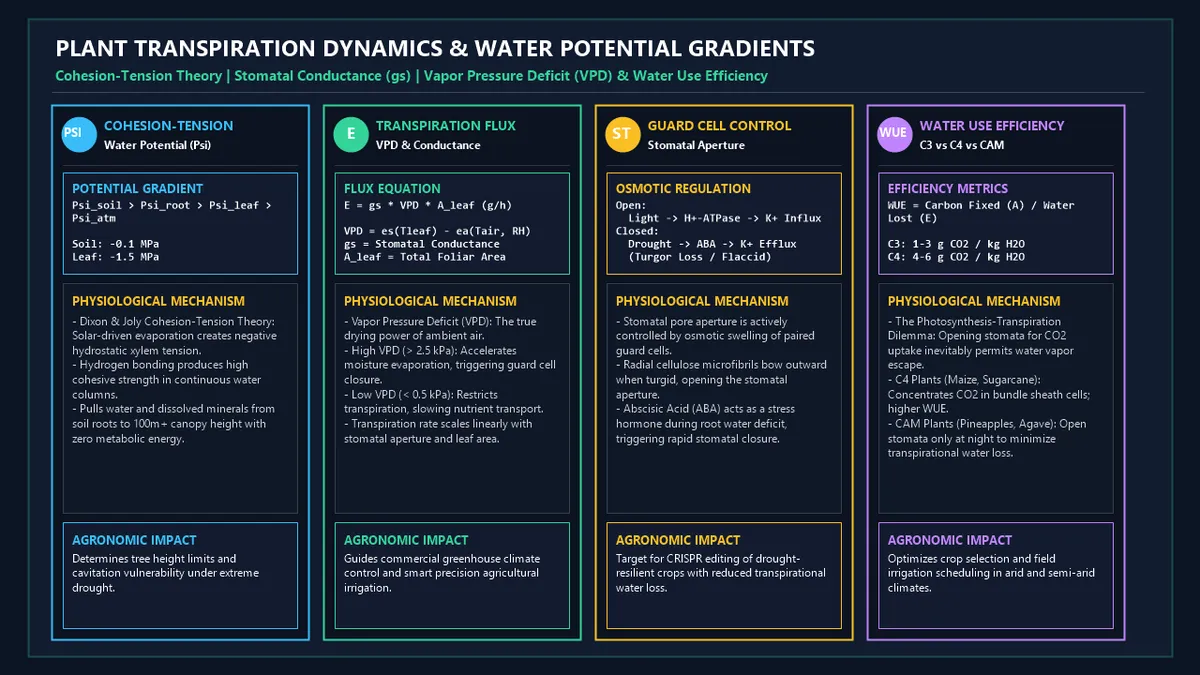
Governing Math Formula: Transpiration Loss: E = (Leaf Area / 100) × Rate (g/h). Vapor Pressure Deficit: VPD = es(T) - ea(T, RH). Water Flux: E = gs × VPD × A_leaf. Water Potential: Ψ_soil > Ψ_root > Ψ_stem > Ψ_leaf > Ψ_air.
Target Applications: Provides real-time quantitative solutions in Biology for students, engineers, researchers, and finance professionals.
Plant Transpiration Water Loss Solver: Stomatal Conductance, Cohesion-Tension & VPD Guide
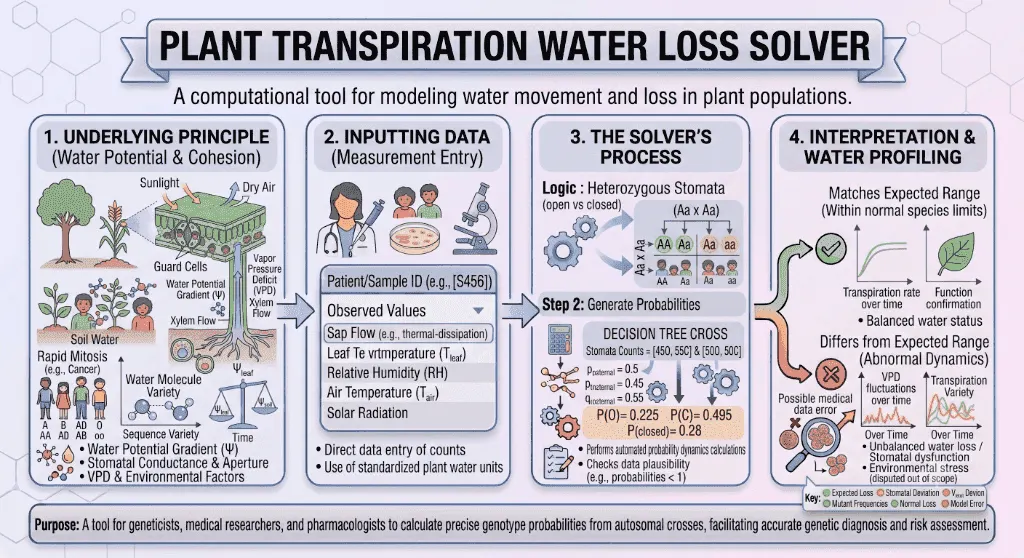
1. Introduction
In plant physiology, agricultural agronomy, forestry, and global climate modeling, Transpiration is the fundamental physiological process by which water is absorbed by roots, transported upward through the vascular xylem, and evaporated into the atmosphere primarily through microscopic foliar pores called stomata. Over 95% of all water absorbed by a plant is lost via transpiration, with less than 5% retained for metabolic growth and photosynthesis.
Far from being a wasteful byproduct, transpiration powers the Transpiration Stream, generating the massive negative hydrostatic pressure gradients that pull mineral nutrients from the soil to the highest canopies of forest giants without consuming metabolic ATP. Furthermore, the high latent heat of vaporization of water provides vital evaporative cooling, preventing lethal thermal denaturing of photosynthetic enzymes under intense summer sunlight.
The driving force of transpiration is governed by the Cohesion-Tension Theory and the atmospheric Vapor Pressure Deficit (). When stomatal guard cells open to permit entry for photosynthesis, water vapor inevitably diffuses out along a steep water potential gradient ().
In modern commercial agriculture, calculating transpirational water loss based on Leaf Area Index (), Stomatal Conductance (), and allows precision drip irrigation systems to deliver the exact volume of replacement water needed, eliminating water waste while preventing drought-induced xylem cavitation.
How do environmental factors like temperature, relative humidity, and wind speed dictate the evaporative pull? How does the plant hormone Abscisic Acid (ABA) regulate guard cell turgor to halt moisture loss?
This comprehensive guide details the biophysical equations, water potential gradients, stomatal regulatory pathways, and agronomic case studies governing plant transpiration.
flowchart LR
    SOIL["🌱 Soil Water Potential (Ψsoil ≈ -0.1 MPa)
Root Osmotic Absorption & Radial Transport"] --> XYLEM["🪵 Vascular Xylem Ascent
Cohesion-Tension Hydrostatic Pull
Negative Tension (Ψleaf ≈ -1.5 MPa)"]
    XYLEM --> STOMATA["🍃 Stomatal Diffusion (gs)
Guard Cell Turgor & Aperture Regulation
Vapor Pressure Deficit (VPD)"]
    STOMATA --> ATMOS["☁️ Atmospheric Loss (Ψair ≈ -100 MPa)
Evaporative Transpiration & Canopy Cooling"]
2. Definitions
2.1 Simple Everyday Definition
Plant Transpiration is the natural evaporation of water from plant leaves into the air through tiny adjustable pores (stomata), acting like a giant solar-powered pump that pulls water and minerals up from the roots to the leaves.
2.2 Formal Technical Definition
The Transpiration Rate () is the mass or molar flux of water vapor escaping from plant foliage per unit time, governed by Fick's Law of Diffusion as the product of Stomatal Conductance (), Total Foliar Surface Area (), and the Vapor Pressure Deficit ():
Where:
- is the Transpiration Rate (, , or ).
- is the Stomatal Conductance ( or ), quantifying pore aperture permeability.
- is the Vapor Pressure Deficit (), representing the absolute difference between saturated vapor pressure inside the leaf () and actual ambient air vapor pressure ().
- is the Total Leaf Area ( or ).
- $\Psi$ is the Water Potential (), where water moves spontaneously from high (less negative) to low (more negative) potential:
2.3 Vivid Real-World Analogies
The Giant Solar-Powered Straw:
A tree does not pump water from the bottom; the sun sucks water from the top. As sunlight evaporates water molecules from leaf mesophyll cells, hydrogen bonds between water molecules link them together in a continuous, unbroken chain all the way down the trunk to the roots—like liquid beads on a string pulled through a straw.
The Evaporative Cooling Tower:
On a scorching summer day, a mature oak tree transpires over of water. The energy absorbed to vaporize this water cools the leaf canopy by below ambient air temperature, preventing heat stress in the exact same manner as industrial cooling towers.
3. History & Scientific Milestones
The physical understanding of botanical sap ascent required over two centuries of biophysical research.
flowchart TD
    H1["📅 1727: Rev. Stephen Hales
Publishes 'Vegetable Staticks'—first quantitative measurement of transpiration in sunflowers"] --> H2["📅 1894: Henry Dixon & John Joly
Formulate the Cohesion-Tension Theory of sap ascent in xylem vessels"]
    H2 --> H3["📅 1898: Francis Darwin
Designs the Horn Potometer to measure stomatal water loss under varying light & humidity"]
    H3 --> H4["📅 1965: John L. Monteith
Derives the Penman-Monteith Equation for canopy evapotranspiration (FAO-56 standard)"]
    H4 --> H5["📅 1985: Granier & Cermák
Develop Thermal Dissipation Probes (TDP) for continuous in vivo tree sap flow monitoring"]- Rev. Stephen Hales (1727): Father of plant physiology; published Vegetable Staticks, conducting the first empirical mass-balance experiments measuring daily transpiration in potted sunflowers ().
- Henry H. Dixon & John Joly (1894): Proposed the Cohesion-Tension Theory, demonstrating that the high tensile strength of cohesive water columns () allows solar evaporation to pull sap to the top of tall trees without cavitation under negative hydrostatic pressures.
- Francis Darwin (1898): Invented the Potometer, providing a laboratory apparatus to measure how wind, illumination, and relative humidity modulate transpirational uptake rates.
- John Lennox Monteith (1965): Combined energy balance and aerodynamic transport into the Penman-Monteith Equation, establishing the universal FAO standard for crop reference evapotranspiration ().
- André Granier (1985): Developed Constant Heat Dissipation Sap Flow Sensors, allowing real-time, non-destructive telemetry of whole-tree transpirational flux in field forests.
4. Core Concepts & Botanical Mechanisms
graph TD
    MECH["🌿 Biophysical Drivers of Plant Transpiration"]

    MECH --> COHESION["1. Cohesion-Tension Ascent
• Continuous water columns held by intermolecular H-bonding
• Negative xylem tension: Ψleaf (-1.5 MPa) to Ψsoil (-0.1 MPa)
• Zero ATP consumption; powered entirely by solar radiation"]
    MECH --> VPD_DRIVE["2. Vapor Pressure Deficit (VPD)
• VPD = es(Tleaf) - ea(Tair, RH)
• High VPD (> 2.0 kPa) accelerates evaporative suction
• Low VPD (< 0.5 kPa) slows transpiration, causing nutrient stalls"]
    MECH --> GUARD_CELLS["3. Stomatal Guard Cell Control
• Light / low CO2 → H+-ATPase → K+ influx → Turgid (Open)
• Drought / high VPD → Abscisic Acid (ABA) → K+ efflux → Flaccid (Closed)"]
4.1 The Water Potential ($\Psi$) Gradient from Soil to Atmosphere
Water moves passively along a thermodynamic gradient of decreasing free energy:
- Soil (): High free water availability in moist loam.
- Root Cortex (): Osmotic solute accumulation () draws water across the endodermis via aquaporins.
- Xylem Conduit (): Hydrostatic negative tension () pulls water upward through dead tracheids/vessels.
- Sub-stomatal Mesophyll (): Meniscus surface tension in cell wall microfibrils creates massive localized suction.
- Atmospheric Air ( at ): Colossal evaporative gradient driving vapor diffusion through stomatal apertures.
4.2 Guard Cell Osmotic Mechanics & ABA Signaling
- Stomatal Opening: Blue light activates plasma membrane proton pumps, hyperpolarizing guard cells and driving rapid influx of and ions. Osmotic water influx increases turgor pressure; because inner cell walls are thicker, guard cells bow outward, opening the pore.
- Stomatal Closure: Under root drought stress, roots synthesize Abscisic Acid (ABA), which is transported via xylem to leaves. ABA binds PYR/RCAR receptors, activating SLAC1 anion channels and causing massive and efflux. Guard cells lose turgor and become flaccid, sealing the stomatal pore.
4.3 Vapor Pressure Deficit () vs. Relative Humidity ()
While Relative Humidity () measures the percentage of saturation, Vapor Pressure Deficit () measures the absolute drying capacity of ambient air in kilopascals ():
- Low (): Air is near-saturated; transpiration is sluggish, reducing calcium and boron transport to growing tips and encouraging fungal botrytis.
- Optimal (): Ideal transpirational flow, nutrient delivery, and assimilation for most greenhouse crops.
- High (): Arid air creates excessive evaporative pull, causing stomatal closure, wilting, and reduced photosynthesis.
5. Formulas & Mathematical Derivations
5.1 Basic Potometer Transpiration Equation
Where is in and is in ().
5.2 Vapor Pressure Deficit () Calculations
- Saturated Vapor Pressure () at Temperature ():
- Actual Ambient Vapor Pressure ():
- Vapor Pressure Deficit ():
5.3 Stomatal Transpiration Flux Equation
Converting molar flux to mass rate ():
5.4 Canopy Field Water Requirement
5.5 Variable Reference Table
| Parameter | Symbol | Standard Units | Physiological Role |
|---|---|---|---|
| Total Leaf Surface Area | or | Total evaporative foliar surface | |
| Specific Transpiration Rate | Evaporative loss per unit leaf area | ||
| Stomatal Conductance | Permeability of stomatal pore network | ||
| Air Temperature | Ambient thermal kinetic energy | ||
| Relative Humidity | Atmospheric moisture saturation fraction | ||
| Saturated Vapor Pressure | Vapor pressure at 100% air saturation | ||
| Vapor Pressure Deficit | Atmospheric evaporative driving force | ||
| Leaf Area Index | Ratio of foliar area to ground surface area | ||
| Water Potential | $\Psi$ | Thermodynamic chemical potential of water |
6. Step-by-Step Computational Walkthrough
Let us calculate the transpirational moisture loss for a greenhouse bell pepper plant:
- Total foliar surface area:
- Measured specific transpiration rate:
- Ambient air temperature:
- Ambient relative humidity:
- Daily photoperiod:
flowchart TD
    STEP1["Step 1: Convert Leaf Area to dm²
Area = 150 cm² / 100 = 1.50 dm²"] --> STEP2["Step 2: Calculate Hourly Water Loss
E_hourly = 1.50 dm² × 2.5 g/dm²·h = 3.75 g/h (3.75 mL/h)"]
    STEP2 --> STEP3["Step 3: Solve Daily Transpiration Volume
E_daily = 3.75 g/h × 10 hours = 37.5 g/day (37.5 mL/day = 0.0375 L/day)"]
    STEP3 --> STEP4["Step 4: Calculate Saturated Vapor Pressure (es)
es(28°C) = 0.61078 × exp((17.27 × 28) / (28 + 237.3)) = 3.78 kPa"]
    STEP4 --> STEP5["Step 5: Determine Vapor Pressure Deficit (VPD)
ea = 3.78 × (50/100) = 1.89 kPa
VPD = 3.78 - 1.89 = 1.89 kPa (Moderate High Demand)"]- Step 1: Convert Foliar Area to Square Decimeters:
- Step 2: Calculate Hourly Transpiration Loss ():
- Step 3: Calculate Cumulative Daily Water Consumption:
- Step 4: Calculate Saturated Vapor Pressure ():
- Step 5: Calculate Actual Vapor Pressure () and :
7. Visual Explanations & Water Potential Spectrum
flowchart TD
    VPD_SPEC["Atmospheric Vapor Pressure Deficit (VPD) Climate Spectrum"]

    VPD_SPEC --> LOW_VPD["🔵 Low VPD Zone (< 0.5 kPa - High Humidity / Fog)
• Transpiration stalls; reduced sap ascent and calcium deficiency
• Prolonged leaf wetness promotes botrytis and powdery mildew"]

    VPD_SPEC --> OPT_VPD["🟢 Optimal Growth Zone (0.8 to 1.5 kPa)
• Ideal balance between stomatal conductance, CO2 intake, and cooling
• Maximum vegetative biomass gain in greenhouse crops"]

    VPD_SPEC --> HIGH_VPD["🟡 High Evaporative Zone (1.5 to 2.2 kPa)
• Rapid transpirational flux; elevated irrigation requirement
• Typical of bright summer midday field conditions"]

    VPD_SPEC --> EXTREME_VPD["🔴 Severe Aridity Zone (> 2.5 kPa - Heat / Drought Stress)
• Severe transpiration exceeds root water uptake
• Triggers ABA synthesis, stomatal closure, and risk of xylem cavitation"]
8. Comparative & Standards Tables
8.1 Photosynthetic Pathway Water Relations ( vs. vs. )
| Feature | Plants (Wheat, Rice, Trees) | Plants (Maize, Sugarcane) | Plants (Agave, Pineapple, Cacti) |
|---|---|---|---|
| Initial Fixation | Rubisco (Daytime) | PEP Carboxylase (Daytime) | PEP Carboxylase (Nighttime) |
| Stomatal Behavior | Open during day | Open during day | Open exclusively at night |
| Transpiration Rate | High () | Moderate () | Ultra-low () |
| Water Use Efficiency () | |||
| Water Consumed per Gram Biomass | |||
| Drought Vulnerability | High | Moderate | Exceptionally drought-hardy |
8.2 Typical Stomatal Conductances & Transpiration Rates Across Plant Species
| Plant Species | Ecological Habitat | Stomatal Conductance () | Peak Transpiration Rate () | Typical Daily Water Consumption |
|---|---|---|---|---|
| **Sunflower (Helianthus annuus)** | Open agricultural field | |||
| **Maize (Zea mays)** | Temperate cropland | |||
| **Soybean (Glycine max)** | Agricultural field | |||
| **Tomato (Solanum lycopersicum)** | Controlled greenhouse | |||
| **Coast Redwood (Sequoia)** | Temperate coastal rainforest | |||
| **Mature English Oak (Quercus)** | Deciduous temperate forest | |||
| **Prickly Pear (Opuntia)** | Arid desert scrub |
9. Practical Real-World Applications
Example 1: Commercial Greenhouse Climate & VPD Optimization
Commercial hydroponic tomato and cannabis growers monitor continuously using computerized aspirating psychrometers. When climbs above , automated high-pressure fogging systems mist the air to lower , preventing midday stomatal shutdown.
Example 2: Precision Drip Irrigation Scheduling (Evapotranspiration Deficit)
Corn farmers in water-restricted basins measure canopy Leaf Area Index () and local to calculate exact daily evapotranspiration (), replacing exactly via root-zone drip lines.
Example 3: Urban Heat Island Mitigation via Tree Canopies
Urban planners plant broadleaf deciduous trees (such as London planes and maples) in asphalt corridors. Transpirational evaporative cooling from a single mature tree provides the cooling equivalent of operating continuously.
10. In-Depth Case Studies
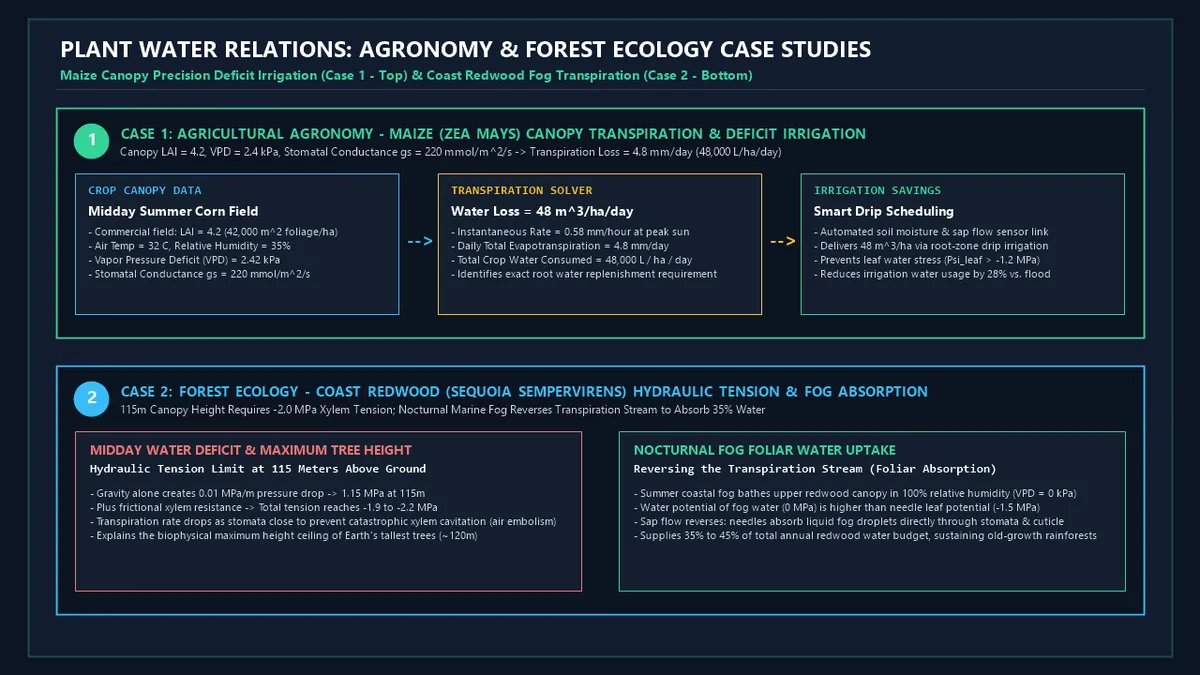
Case Study 1: Agricultural Agronomy — Maize (Zea mays) Canopy Transpiration & Deficit Irrigation
- Agronomic Setting: A commercial corn farm in the semi-arid Central Valley experiences summer heat waves ().
- Canopy & Biophysical Inputs:- Crop Leaf Area Index: ()- Stomatal Conductance:- Atmospheric : (Elevated evaporative demand)
- Calculated Transpiration Water Loss:- Peak midday flux:- Total cumulative daily crop transpiration:- Daily irrigation demand for :
- Agronomic Outcome: Integrating continuous sap flow sensors and modeling with subsurface drip irrigation prevented leaf water stress (), achieving a compared to conventional center-pivot flooding.
Case Study 2: Forest Ecology — Coast Redwood (Sequoia sempervirens) Hydraulic Tension & Fog Absorption
- Ecological Context: Old-growth Coast Redwoods in Northern California achieve towering heights exceeding .
- Hydraulic Tension Limit:- Gravity alone imposes a hydrostatic vertical gradient of ( at ).- Combined with xylem frictional resistance, total negative tension in top needles reaches during midday transpiration.- Stomata close around noon to prevent catastrophic xylem cavitation (air embolism), defining the biophysical height limit of Earth's trees ().
- Nocturnal Fog Foliar Water Uptake:- Summer marine fog blankets the redwood canopy with ().- The water potential of pure fog droplets () is higher than the dehydrated needle water potential ().- Sap flow reverses: needle stomata and cuticular pores directly absorb liquid fog water, transporting moisture downward into the stems.- This foliar absorption supplies of the redwood forest's total annual water budget.
11. Advantages of Plant Transpiration Modeling
- Optimizes Agricultural Water Use: Prevents over-irrigation and nutrient leaching by matching water delivery to actual transpiration loss.
- Prevents Crop Heat Stress: Ensures stomata remain sufficiently open to provide evaporative canopy cooling.
- Maintains Vascular Integrity: Avoids excessive negative xylem tension that causes irreversible cavitation embolisms.
- Calculates Greenhouse VPD Targets: Guides computerized ventilation, misting, and heating for greenhouse crops.
12. Methodological Complexities & Artifacts
- Boundary Layer Resistance: In still, unventilated air, a boundary layer of humid air clings to the leaf surface, artificially suppressing transpiration even under low ambient relative humidity.
- Xylem Cavitation & Embolisms: When soil drought increases tension beyond , dissolved gases spontaneously nucleate, breaking the water column and disabling sap flow.
- Cuticular Transpiration Leakage: Even when stomata are fully closed at night, of water continues to evaporate through the waxy cuticle.
13. Common Mistakes to Avoid
1. Managing Greenhouses by Relative Humidity Instead of VPD:
at () has a completely different evaporative demand than at (). Always use .
2. Assuming Closed Stomata Means Zero Water Loss:
Cuticular transpiration and imperfect stomatal closure during severe heat stress continue to drain plant moisture reserves.
3. Irrigating Without Accounting for Leaf Area Index (LAI):
Young crops with consume less than one-third the water of a mature closed canopy with under identical weather conditions.
12. Frequently Asked Questions (FAQ)
What is the primary driving force of transpiration?
The primary driving force is the Vapor Pressure Deficit () between the water-saturated air inside the leaf sub-stomatal cavity () and the drier ambient atmosphere, pulling water upward via the Cohesion-Tension mechanism.
How does light affect transpiration rate?
Light stimulates proton pumps in guard cells, driving ion influx and osmotic water swelling, which opens stomata to permit uptake for photosynthesis while increasing transpiration.
Why do plants wilt during hot afternoons even in moist soil?
When atmospheric and solar radiation are extreme, the rate of water evaporation from leaves can exceed the physical maximum rate of water uptake through roots and xylem, causing temporary loss of cellular turgor (wilting).
What is the role of Abscisic Acid (ABA) in transpiration?
Abscisic Acid (ABA) is a plant stress hormone synthesized during drought that triggers rapid ion efflux () from guard cells, deflating them and closing stomata to conserve water.
What is the difference between transpiration and guttation?
Transpiration is the evaporative loss of water vapor through stomata driven by solar energy. Guttation is the exudation of liquid water droplets through specialized vein endings (hydathodes) caused by positive root pressure during humid nights.
How do CAM plants survive in arid deserts?
plants (e.g., cacti, agave, pineapple) keep stomata tightly closed during hot daylight hours to prevent transpiration, opening them only at night to absorb and store as malic acid for daytime photosynthesis.
What is xylem cavitation?
Cavitation is the formation of air bubbles (embolisms) within xylem vessels when negative hydrostatic tension becomes too extreme, breaking the continuous water column and blocking water transport.
15. Expert Tips for Agronomists, Botanists & Plant Physiologists
- Target Greenhouse VPD Between : Maintaining this sweet spot optimizes fixation while ensuring continuous calcium transpiration to fruit tips (preventing blossom end rot).
- Account for Boundary Layer Dynamics: Ensure adequate horizontal air circulation () in indoor grow rooms to strip away stagnant boundary layers and maintain uniform transpiration.
- Monitor Pre-Dawn Leaf Water Potential (): Measuring with a Scholander pressure chamber before sunrise provides the most accurate biological measurement of true soil moisture availability, as leaves equilibrate with root-zone moisture overnight.
16. Summary Checklist
- ✔ Measure Foliar Surface Area () or : Quantify total evaporative canopy dimension.
- ✔ Calculate Vapor Pressure Deficit (): Evaluate in .
- ✔ Determine Stomatal Conductance (): Measure pore aperture permeability.
- ✔ Solve Transpiration Flux (): Compute hourly and cumulative daily moisture loss.
- ✔ Evaluate Water Potential Gradient ($\Psi$): Verify cohesive xylem tension from soil to atmosphere.
- ✔ Adjust Irrigation Schedules: Deliver precise replacement volumes based on measured canopy transpiration.
- ✔ Optimize Greenhouse Climate Controls: Regulate fogging and ventilation to maintain target zones.
Additional Technical Guidelines & Measurement Standards
When conducting calculations for Plant Transpiration Water Loss Solver, maintaining quantitative precision and verifying input parameter boundaries is essential for reliable scenario evaluation. Always verify that raw numerical inputs are measured using standardized instrumentation, and double-check unit conversions prior to applying outputs in commercial, industrial, or academic projects.
For quantitative unit conversions and scientific calculations, always maintain at least four decimal places of precision during intermediate arithmetic stages before rounding final results. When preparing technical reports, laboratory documentation, or financial forecasts, cross-verify all output variables against established international measurement standards (such as SI, NIST, and ISO metric benchmarks) to guarantee consistent analytical rigor across all computational workflows.
MathsLover.com delivers this interactive solver 100% free of charge to foster global mathematical literacy, educational accessibility, and data-driven problem solving across scientific, technical, and academic communities worldwide.