💡 Direct Answer & Executive Summary (Mitotic Index Percentage Cell Divider)
Definition: Calculate the Mitotic Index (MI %), growth fraction, mitotic figures per 10 High Power Fields (HPF), and Nottingham tumor proliferation grade from cell cycle counts.
Governing Math Formula: Mitotic Index: MI (%) = [(Prophase + Metaphase + Anaphase + Telophase) / Total Cells Scanned] × 100%. Nottingham Score: 1 (<10 mitoses/10 HPF), 2 (10-19 mitoses/10 HPF), 3 (≥20 mitoses/10 HPF).
Target Applications: Provides real-time quantitative solutions in Biology for students, engineers, researchers, and finance professionals.
Mitotic Index Percentage Cell Divider: Proliferation Kinetics, Cell Cycle & Tumor Grading Guide
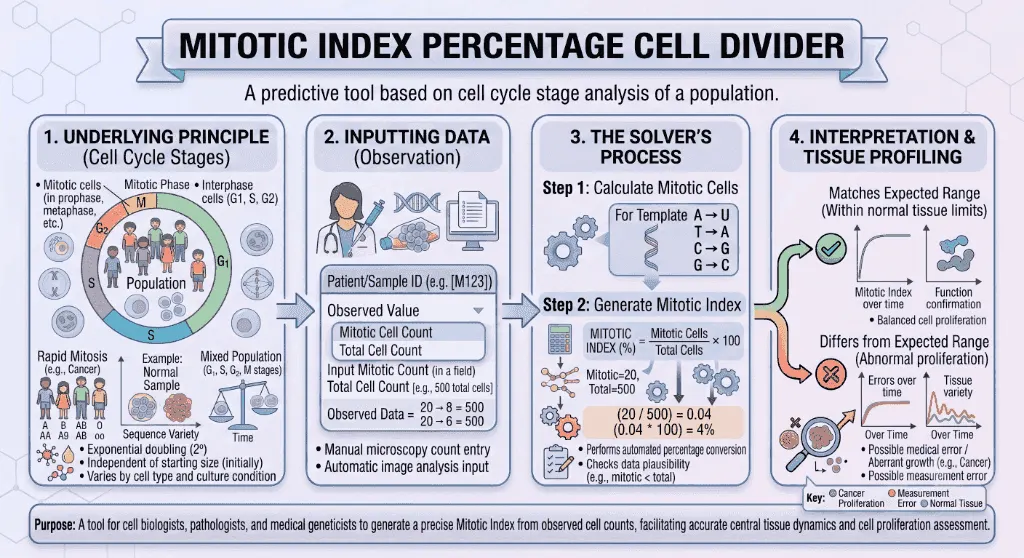
1. Introduction
In histology, oncology, cytogenetics, and developmental biology, tissue growth is governed by the delicate balance between cellular quiescence, division, and programmed cell death. The Mitotic Index () is a quantitative cytological metric that measures the proportion of cells within a tissue or cell culture actively undergoing mitosis () relative to the total population.
Under a brightfield microscope or automated digital pathology scanner, resting interphase cells exhibit intact nuclear membranes and diffuse chromatin, whereas mitotic cells display distinct, darkly stained condensed chromosomes aligned along the spindle apparatus.
In surgical pathology, the mitotic index serves as one of the most powerful prognostic indicators of cancer aggression. In breast oncology, the Nottingham Histological Score relies directly on standardized mitotic counts per 10 high-power fields () to differentiate indolent Grade 1 tumors from highly aggressive Grade 3 carcinomas requiring systemic cytotoxic chemotherapy. In pharmacology, measuring shifts in mitotic index identifies whether an anti-cancer compound acts as a mitotic spindle poison (such as Paclitaxel or Vincristine).
How is the Mitotic Index calculated from microscopic fields? What distinguishes true mitotic figures from apoptotic debris? How do pathologists standardize mitotic counts across different microscope field diameters?
This comprehensive guide details the mathematical equations, cellular mechanics, oncological grading guidelines, and clinical applications of the Mitotic Index.
flowchart LR
    BIOPSY["🔬 Tissue Biopsy / Cell Culture
H&E Staining / Microscopic Scan
(e.g., 10 High Power Fields)"] --> COUNT["🔢 Cell Cycle Quantification
Count Mitotic Figures (Nm)
Count Total Scanned Cells (Ntotal)"]
    COUNT --> SOLVER["🧮 Mitotic Index Solver
MI (%) = (Nm / Ntotal) × 100%
Density: Mitoses / 10 HPF"]
    SOLVER --> PATH["🎗️ Clinical & Diagnostic Action
Nottingham Grading, Chemo Selection & Prognosis"]
2. Definitions
2.1 Simple Everyday Definition
The Mitotic Index () is the percentage of cells in a sample that are actively dividing at any given moment. A high mitotic index means the tissue is growing or multiplying rapidly (like a tumor or a healing wound), while a low index means the tissue is resting.
2.2 Formal Technical Definition
The Mitotic Index () is the dimensionless ratio of cells in any of the four active stages of nuclear division (Prophase, Metaphase, Anaphase, Telophase) to the total number of cells observed in a representative cytological or histopathological field:
Where:
- is the number of cells in Mitosis ().
- is the total number of cells ().
- $P, M, A, T$ represent individual cell counts in Prophase, Metaphase, Anaphase, and Telophase.
In surgical pathology, when individual cell counting is impractical across whole tissue sections, the mitotic rate is standardized as the Mitotic Count per or per of tumor area.
2.3 Vivid Real-World Analogies
The Traffic Camera at the Intersection:
Imagine a high-speed traffic camera taking a single snapshot of a 10-lane highway. Most cars are cruising smoothly in lane (Interphase, 95%). A few cars are actively executing a lane change or turning through the intersection (Mitosis, 5%). The Mitotic Index is the percentage of vehicles caught mid-turn in that single snapshot.
The Factory Assembly Snapshot:
Think of a manufacturing plant producing identical parts. Out of workbenches, are assembling internal components (Interphase), while are performing the final physical split of the unit into two boxed products (Mitosis). The factory's mitotic index is .
3. History & Scientific Milestones
The discovery of mitosis and its mathematical quantification laid the bedrock for cellular pathology and modern oncology.
flowchart TD
    M1["📅 1882: Walther Flemming
Discovers and names Mitosis; stains condensed chromatin with aniline dyes"] --> M2["📅 1890: David von Hansemann
Identifies asymmetrical, multipolar mitotic figures in malignant carcinomas"]
    M2 --> M3["📅 1957: Bloom & Richardson
Establishes mitotic figure density as a core criterion in breast cancer grading"]
    M3 --> M4["📅 1983: Johannes Gerdes
Discovers Ki-67 antigen as an immunohistochemical marker for non-G0 proliferating cells"]
    M4 --> M5["📅 1991: Elston & Ellis (Nottingham System)
Standardizes mitotic counts per 10 HPFs, establishing modern gold-standard grading"]- Walther Flemming (1882): Published Zellsubstanz, Kern und Zelltheilung, coining the term Mitosis (from the Greek mitos, meaning "thread") and detailing the sequential stages of chromosome condensation, alignment, and separation.
- David von Hansemann (1890): Recognized that malignant tumors exhibit a higher frequency of cell division and discovered atypical multipolar mitotic figures (tripolar and tetrapolar spindles), linking mitotic errors directly to cancer aneuploidy.
- H.J. Bloom & W.W. Richardson (1957): Formulated the first systematic histological grading system for breast cancer, incorporating tubule formation, nuclear pleomorphism, and mitotic frequency.
- Johannes Gerdes et al. (1983): Generated the Ki-67 monoclonal antibody, which detects a nuclear protein present during all active phases of the cell cycle () but absent in quiescent cells, providing an immunohistochemical companion to the optical mitotic index.
- C.W. Elston & I.O. Ellis (1991): Refined the Nottingham Combined Histological Grade (Elston-Ellis modification), establishing standardized cutoff thresholds for mitotic figure counts per unit area (, , ).
4. Core Concepts & Biochemical Mechanisms
graph TD
    CYCLE["🔄 Eukaryotic Cell Cycle Architecture"]

    CYCLE --> INTER["💤 Interphase (90 - 95% of Duration)
• G₁ Phase: Cellular growth & enzyme synthesis
• S Phase: Nuclear DNA replication (2N → 4N)
• G₂ Phase: Spindle protein synthesis & error check
• Microscopic appearance: Diffuse chromatin, intact envelope"]
    CYCLE --> MITOSIS["⚡ M-Phase / Mitosis (5 - 10% of Duration)
• Prophase: Chromosome condensation & centrosome migration
• Metaphase: Equatorial alignment & spindle checkpoint (SAC)
• Anaphase: Cohesin cleavage & sister chromatid separation
• Telophase: Envelope reformation & Cytokinesis cleavage"]

    MITOSIS --> MI_CALC["🧮 Mitotic Index Calculation
MI% = [Mitotic Cells / Total Cells] × 100%"]
4.1 The Four Stages of Nuclear Division ()
- Prophase: Chromatin condenses into distinct pairs of sister chromatids. The nucleolus disappears, and centrosomes migrate to opposite poles, polymerizing the mitotic spindle apparatus.
- Metaphase: The nuclear envelope completely breaks down. Microtubules attach to kinetochores, aligning chromosomes under high tension along the equatorial metaphase plate.
- Anaphase: The Anaphase-Promoting Complex/Cyclosome () triggers degradation of securin, activating separase to cleave cohesin rings. Sister chromatids are rapidly pulled toward opposite spindle poles.
- Telophase & Cytokinesis: Nuclear envelopes reform around the two daughter nuclei, chromosomes decondense, and an actin-myosin contractile ring pinches the cytoplasm into two independent daughter cells.
4.2 Molecular Control: Cyclin B / CDK1 & The Spindle Assembly Checkpoint
- Mitotic Entry: Entry into mitosis is driven by the activation of Maturation-Promoting Factor (), a heterodimer of Cyclin B1 and CDK1 (Cdc2).
- Spindle Assembly Checkpoint (): The checkpoint proteins Mad2, BubR1, and Bub3 monitor kinetochore tension. If even a single kinetochore remains unattached to a microtubule, the SAC halts the cell cycle in prometaphase. Anti-mitotic drugs (such as Taxanes) exploit this checkpoint to trap cancer cells in mitosis.
5. Formulas & Mathematical Derivations
5.1 The Mitotic Index Formula
5.2 Standardized Mitotic Density per 10 High Power Fields
When evaluating under a ():
Where is the total number of fields examined (standard ).
5.3 Field Area Standardization Formula
Because microscope oculars vary in field number (, typically ), the actual field area () is:
5.4 Variable Reference Table
| Parameter | Symbol | Units | Clinical / Pathological Role |
|---|---|---|---|
| Mitotic Cell Count | Cells | Total cells in active division ($P+M+A+T$) | |
| Total Cell Count | Cells | Sum of dividing and resting interphase cells | |
| Mitotic Index | Percentage | Quantifies instantaneous proliferative fraction | |
| High Power Fields | Count | Standardized microscopic evaluation windows | |
| Nottingham Mitotic Score | Score | Points | Core parameter in histological tumor grading |
| Growth Fraction | Ratio | Fraction of cells actively within the cell cycle |
6. Step-by-Step Computational Walkthrough
Let us calculate the Mitotic Index and Nottingham Histological Mitotic Score for a surgically resected invasive breast carcinoma biopsy:
- Total high power fields examined:
- Total tumor cells scanned across fields:
- Prophase cells observed:
- Metaphase cells observed:
- Anaphase cells observed:
- Telophase cells observed:
- Interphase cells observed:
flowchart TD
    STEP1["Step 1: Sum Total Mitotic Figures (Nm)
Nm = 6 (P) + 8 (M) + 4 (A) + 2 (T) = 20 dividing cells"] --> STEP2["Step 2: Confirm Total Scanned Cells
Ntotal = 20 (Mitotic) + 480 (Interphase) = 500 total cells"]
    STEP2 --> STEP3["Step 3: Solve Mitotic Index Percentage
MI% = (20 / 500) × 100% = 4.00%"]
    STEP3 --> STEP4["Step 4: Calculate Mitotic Density per 10 HPF
Mitoses / 10 HPF = (20 / 10) × 10 = 20.0 mitoses / 10 HPF"]
    STEP4 --> STEP5["Step 5: Determine Nottingham Mitotic Score
Density ≥ 20 mitoses / 10 HPF → Nottingham Mitotic Score = 3 (High)"]- Step 1: Calculate Total Mitotic Figures ():
- Step 2: Calculate Mitotic Index Percentage ():
- Step 3: Calculate Interphase Resting Fraction:
- Step 4: Standardize Mitotic Density per 10 HPF:
- Step 5: Assign Nottingham Histological Mitotic Score:- Score 1:- Score 2:- Score 3:- Result: Score 3 (High Proliferation), contributing toward the patient's combined histological grade.
7. Visual Explanations & Cell Cycle Breakdown
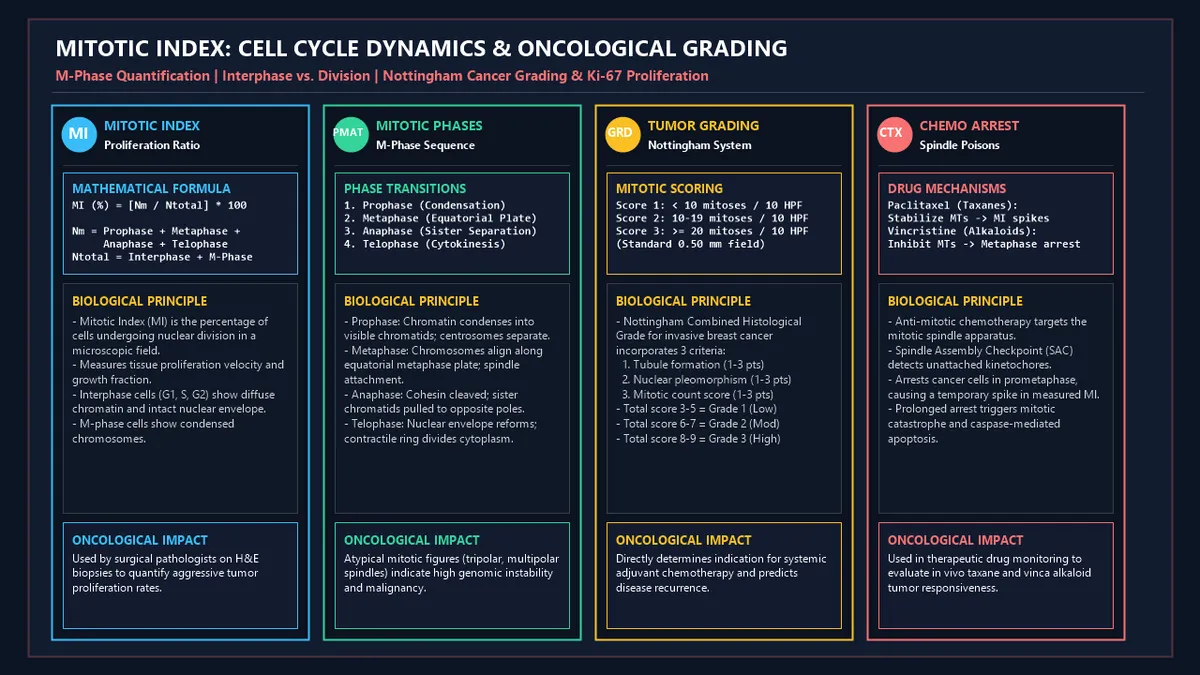
flowchart TD
    MI_SPECTRUM["Mitotic Index (MI) Spectrum Across Human Tissues"]

    MI_SPECTRUM --> QUIESCENT["🌿 Normal Quiescent Tissue (MI ≤ 1.0%)
• Normal Dermis & Subcutis (~0.2%)
• Resting Mammary Glandular Epithelium (~0.5%)
• Adult Liver Hepatocytes (< 0.1%)"]
    MI_SPECTRUM --> TURNOVER["🔬 High-Turnover Normal & Hyperplasia (MI: 2.0% - 5.0%)
• Intestinal Crypts of Lieberkühn (~3.5% - 5.0%)
• Bone Marrow Erythroblasts & Granulocytes
• Reactive Lymphoid Follicular Hyperplasia"]
    MI_SPECTRUM --> CANCER["⚡ Malignant Neoplasms & Carcinomas (MI: 5.0% - 20.0%)
• Invasive Ductal Breast Carcinoma (Grade 3)
• Glioblastoma Multiforme (GBM)
• Small Cell Lung Carcinoma (SCLC)"]
    MI_SPECTRUM --> ARREST["🛑 Spindle Poison Arrest / Taxanes (MI > 25.0%)
• Paclitaxel / Docetaxel Induced Prometaphase Arrest
• Colchicine Karyotype Metaphase Arrest"]
8. Comparative & Standards Tables
8.1 Mitotic Index Across Representative Tissues and Tumors
| Tissue / Pathological Condition | Classification | Expected Mitotic Index () | Mitoses per 10 HPF | Proliferative Status |
|---|---|---|---|---|
| Normal Dermis / Fibroblasts | Quiescent Somatic | Minimal baseline renewal | ||
| Resting Breast Epithelium | Quiescent Glandular | Hormone-dependent quiescence | ||
| Intestinal Mucosa (Crypts) | Rapid Normal Renewal | High physiological turnover | ||
| Benign Fibroadenoma | Benign Neoplasm | Slow indolent expansion | ||
| Grade 1 Breast Carcinoma | Low-Grade Malignancy | (Score 1) | Well-differentiated | |
| Grade 2 Breast Carcinoma | Intermediate Malignancy | (Score 2) | Moderately differentiated | |
| Grade 3 Breast Carcinoma | High-Grade Malignancy | (Score 3) | Poorly differentiated, aggressive | |
| Burkitt Lymphoma | High-Grade B-Cell | "Starry-sky" rapid doubling |
8.2 The Nottingham Combined Histological Grading System (Elston-Ellis Modification)
| Feature Assessed | 1 Point | 2 Points | 3 Points |
|---|---|---|---|
| 1. Tubule Formation | of tumor forms tubules | tubule formation | tubule formation (solid sheets) |
| 2. Nuclear Pleomorphism | Small, uniform, regular nuclei | Moderate size & shape variation | Marked variation, prominent nucleoli |
| 3. Mitotic Count (per 10 HPF) |
- Grade 1 (Well Differentiated): Total Score (Favorable prognosis, low recurrence).
- Grade 2 (Moderately Differentiated): Total Score (Intermediate risk).
- Grade 3 (Poorly Differentiated): Total Score (Aggressive behavior, systemic chemotherapy indicated).
9. Practical Real-World Applications
Example 1: Adjuvant Chemotherapy Selection in Luminal Breast Cancer
A patient with hormone-receptor-positive () invasive breast cancer has a tumor with moderate tubule formation () and nuclear atypia ().
- If mitotic count is (), Total Score (Grade 1), and adjuvant chemotherapy can be safely avoided in favor of endocrine therapy alone.
- If mitotic count is (), Total Score (Grade 3), signaling high genomic instability and warranting dose-dense adjuvant AC-T chemotherapy.
Example 2: Plant Root Tip (Allium Cepa) Environmental Mutagenicity Bioassays
Environmental toxicologists expose onion root tips to industrial wastewater effluents. A drop in root apical meristem mitotic index from 8.5% to 1.2% indicates acute environmental cytotoxicity and spindle poisoning.
Example 3: Gastrointestinal Stromal Tumor (GIST) Malignancy Risk
In GIST pathology, risk of metastatic progression is classified strictly by tumor size and mitotic index. Tumors with are classified as high-risk, qualifying patients for adjuvant Imatinib (Gleevec) tyrosine kinase inhibitor therapy.
10. In-Depth Case Studies
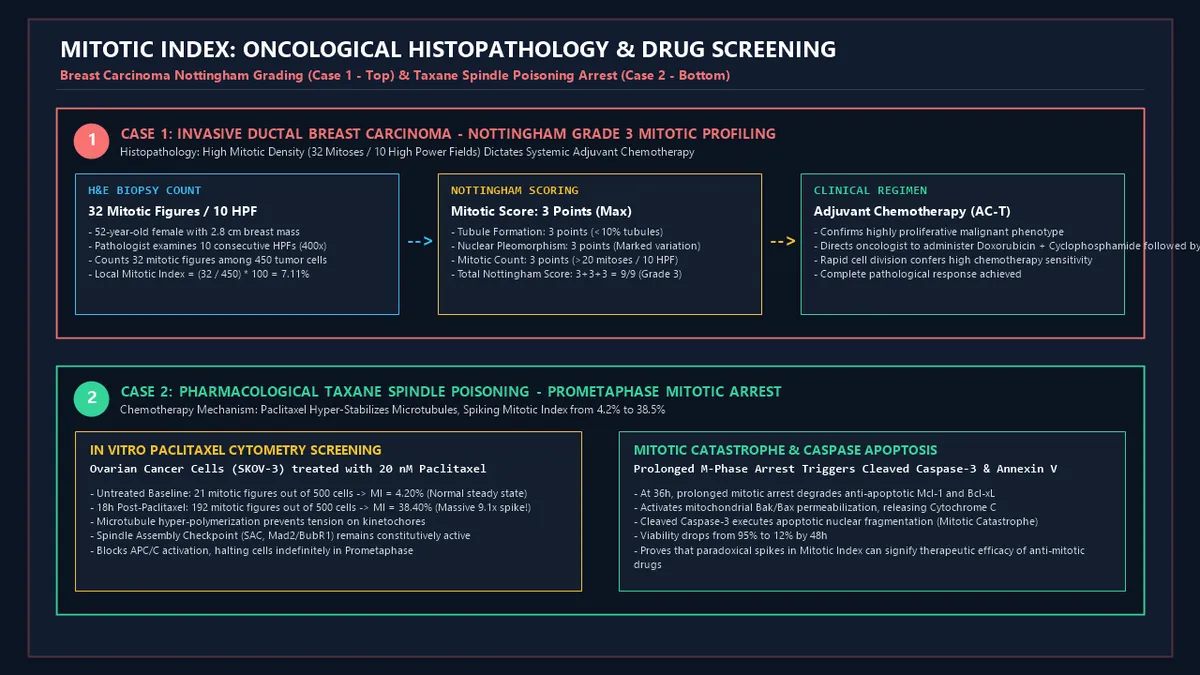
Case Study 1: Invasive Ductal Breast Carcinoma — Nottingham Grade 3 Mitotic Profiling
- Clinical Scenario: A female presents with a palpable mass in the upper outer quadrant of the left breast. Core needle biopsy confirms invasive ductal carcinoma.
- Microscopic Histopathology:- Standardized examination of (, field diameter ) at the tumor periphery.- Pathologist counts a total of among .
- Quantitative Calculations:
- Combined Nottingham Grading:- Tubule Formation Score ( tubules)- Nuclear Pleomorphism Score (Severe pleomorphism)- Mitotic Score ( mitoses)- Total Nottingham Score:
- Clinical Management: The high mitotic index directly indicated rapid tumor proliferation, leading the multidisciplinary tumor board to initiate neoadjuvant Doxorubicin + Cyclophosphamide followed by Paclitaxel (AC-T), resulting in complete pathological response at subsequent mastectomy.
Case Study 2: Pharmacological Taxane Spindle Poisoning — Prometaphase Mitotic Arrest
- Experimental Objective: Evaluate the in vitro pharmacodynamics of Paclitaxel (Taxol) on human SKOV-3 ovarian adenocarcinoma cells.
- Cytological Flow Cytometry Tracking:- Untreated Control: out of (Normal steady-state logarithmic growth).- out of (A massive in Mitotic Index!).
- Molecular Mechanism:- Paclitaxel hyper-stabilizes -tubulin polymers, preventing normal microtubule dynamic instability and spindle tension.- The Spindle Assembly Checkpoint () remains constitutively activated, blocking and trapping cells in Prometaphase.
- Therapeutic Outcome:- At , prolonged mitotic arrest degrades anti-apoptotic Mcl-1, activating Bak/Bax and releasing Cytochrome C.- Cleaved Caspase-3 executes mitotic catastrophe apoptosis, dropping culture viability to 12% by .- This case proves that a paradoxical surge in Mitotic Index during drug testing signals successful therapeutic spindle arrest rather than tumor proliferation.
11. Advantages of Mitotic Index Analysis
- Direct Morphological Evidence of Proliferation: Unlike molecular surrogates, optical mitotic counting captures cells in physical nuclear division.
- Standardized Global Clinical Prognostication: Serves as a validated, internationally recognized component of AJCC cancer staging and Nottingham grading.
- Cost-Effective on Routine H&E Stains: Requires no expensive specialized reagents, antibodies, or fluorescent microscopes.
- Captures Pharmacological Spindle Arrest: Instantly identifies cytostatic mechanism of action for novel anti-tubulin chemotherapeutics.
12. Methodological Complexities & Artifacts
- Apoptotic Debris vs. True Mitotic Figures: Condensed, fragmented apoptotic bodies (pyknosis/karyorrhexis) can easily be misidentified as mitotic figures. True mitoses possess fuzzy, hairy chromosome outlines with no surrounding clear halo.
- Cold Ischemia & Delayed Fixation ("Mitotic Fading"): If surgically removed tissue sits at room temperature for hours before formalin immersion, cells trapped mid-division complete mitosis or undergo autolysis, artificially depressing the measured mitotic count by up to 50%.
- Microscope Field Area Variations: Modern wide-field microscopes ( field diameter) examine nearly double the physical surface area of older scopes per 10 HPFs, requiring mathematical area calibration.
13. Common Mistakes to Avoid
1. Counting Mitoses in Central Necrotic or Hypoxic Zones:
Mitotic figures must be counted exclusively at the active, well-vascularized peripheral advancing tumor edge, avoiding necrotic core regions where cell division has ceased.
2. Confusing Mitotic Index with Ki-67 Proliferation Fraction:
The Mitotic Index measures only cells in active (, ), whereas Ki-67 labeling marks all non- cycling cells (, typically ).
3. Counting Crushed Lymphocytes as Mitoses:
Infiltrating stromal lymphocytes crushed during tissue processing can mimic hyperchromatic mitotic chromatin.
12. Frequently Asked Questions (FAQ)
What is the normal Mitotic Index in healthy human tissues?
In most healthy adult tissues (dermis, resting breast, liver), the normal Mitotic Index is . In rapidly renewing physiological tissues (intestinal crypts, bone marrow, lymphoid germinal centers), the normal index ranges from .
How does the Mitotic Index differ from the Ki-67 index?
The Mitotic Index measures only cells undergoing actual physical mitosis (). Ki-67 immunohistochemistry stains a nuclear protein expressed throughout all active phases of the cell cycle (), resulting in significantly higher percentage values.
What is the significance of atypical mitotic figures in pathology?
Atypical mitotic figures (tripolar, tetrapolar, or ring-shaped spindles) signify centrosome amplification, genomic instability, and high-grade malignancy, commonly seen in glioblastomas, sarcomas, and anaplastic carcinomas.
Why is the Mitotic Index used in the Nottingham breast cancer grading system?
Mitotic rate directly reflects how fast tumor cells are duplicating. Along with tubule formation and nuclear pleomorphism, the mitotic score () determines overall histological grade, which guides decisions on chemotherapy and hormonal therapy.
What is "mitotic fading"?
Mitotic fading occurs when tissue fixation in formalin is delayed after surgical excision. Hypoxic tumor cells complete division or degrade, leading to artificially low mitotic counts and tumor under-grading.
How do taxane chemotherapy drugs affect the Mitotic Index?
Taxanes (Paclitaxel, Docetaxel) prevent microtubule disassembly, activating the spindle assembly checkpoint and trapping cells in prometaphase. This causes a paradoxical spike in Mitotic Index (up to ) prior to apoptotic death.
How many cells should be counted to calculate an accurate Mitotic Index?
In academic cytogenetics and cell biology, counting at least across multiple randomly selected fields is recommended to achieve statistical significance.
15. Expert Tips for Pathologists, Oncologists & Cell Biologists
- Count at the Peripheral Invasive Tumor Edge: Focus your 10 high-power fields on the most cellular, highly proliferative "hotspots" along the leading invasive front of the tumor.
- Calibrate for Your Microscope's Field Number: Determine your microscope's specific field area () to verify whether Nottingham cutoff thresholds require calibration (e.g., ).
- Differentiate Prophase from Pyknotic Apoptosis: Look for irregular, thread-like chromatin projections characteristic of prophase; spherical, smooth, densely shrunken globoid chromatin surrounded by a clear halo indicates apoptosis.
16. Summary Checklist
- ✔ Scan Representative Fields: Select 10 consecutive high-power fields () in active proliferation zones.
- ✔ Count Mitotic Figures (): Identify cells in Prophase, Metaphase, Anaphase, and Telophase.
- ✔ Quantify Total Scanned Cells (): Sum dividing and non-dividing interphase cells.
- ✔ Calculate Mitotic Index Percentage: Solve .
- ✔ Determine Mitotic Density: Standardize to mitoses per 10 HPF or per .
- ✔ Assign Nottingham Mitotic Score: Apply score thresholds ().
- ✔ Correlate with Clinical Presentation: Direct adjuvant oncology protocols or bioassay toxicity assessments.
Additional Technical Guidelines & Measurement Standards
When conducting calculations for Mitotic Index Percentage Cell Divider, maintaining quantitative precision and verifying input parameter boundaries is essential for reliable scenario evaluation. Always verify that raw numerical inputs are measured using standardized instrumentation, and double-check unit conversions prior to applying outputs in commercial, industrial, or academic projects.
For quantitative unit conversions and scientific calculations, always maintain at least four decimal places of precision during intermediate arithmetic stages before rounding final results. When preparing technical reports, laboratory documentation, or financial forecasts, cross-verify all output variables against established international measurement standards (such as SI, NIST, and ISO metric benchmarks) to guarantee consistent analytical rigor across all computational workflows.
MathsLover.com delivers this interactive solver 100% free of charge to foster global mathematical literacy, educational accessibility, and data-driven problem solving across scientific, technical, and academic communities worldwide.