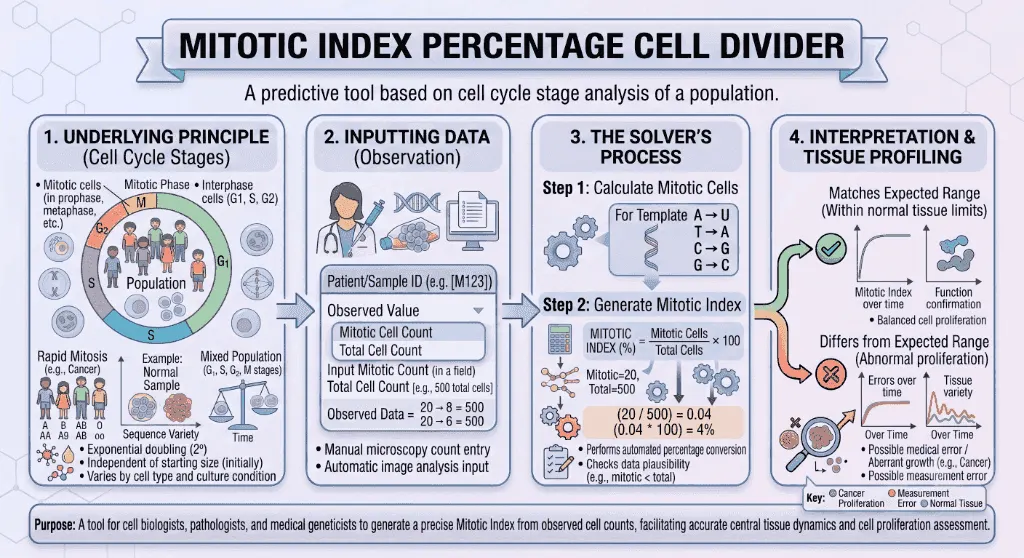
💡 Direct Answer & Executive Summary (Mitotic Cell Division Index Calculator)
Definition: Calculate the Mitotic Index (MI) percentage to evaluate cell proliferation kinetics, tissue growth dynamics, and clinical tumor histopathology grading.
Governing Math Formula: Mitotic Index: MI = (N_m / N_total) × 100%, where N_m is the number of cells in active mitosis (prophase, metaphase, anaphase, telophase) and N_total is the total number of cells observed.
Target Applications: Provides real-time quantitative solutions in Biology for students, engineers, researchers, and finance professionals.
Mitotic Cell Division Index Calculator: Proliferation Kinetics & Histopathology Guide
1. Introduction
Inside the human bone marrow, billions of hematopoietic stem cells divide every second to replace dying red blood cells and combat systemic infections. In the intestinal epithelial crypts, cells replicate rapidly to renew the digestive mucosal lining every four days. Conversely, in malignant solid tumors, defective cell cycle checkpoints unleash unrestrained cellular proliferation, driving invasive tissue destruction.
How do pathologists determine whether a surgically resected tumor is slow-growing and indolent or aggressively malignant? How do toxicologists test whether agricultural pesticides or industrial chemical effluents inhibit plant root growth and damage chromosomal architecture?
The universal quantitative metric used across clinical medicine and experimental cell biology is the Mitotic Index (MI).
flowchart LR
    SAMPLE["🔬 Biological Tissue Specimen
(Histology Slide / Meristem Squash)"] --> COUNT["👁️ Microscopic Cell Survey
Count Mitotic (Nm) & Total (Ntotal)"]
    COUNT --> CALC["🧮 Mitotic Index Equation
MI = (Nm / Ntotal) × 100%"]
    CALC --> EVAL["📊 Clinical & Biological Assessment
Normal Homeostasis vs. Neoplastic Malignancy"]
By calculating the proportion of cells actively navigating the nuclear division stages (), the Mitotic Index provides an immediate, highly reliable readout of tissue growth velocity and regenerative capacity.
2. Definitions
2.1 Simple Everyday Definition
The Mitotic Index (MI) is the percentage of cells in a tissue sample that are actively dividing at any given moment. If you scan a microscope slide containing and see actively splitting in half, the Mitotic Index is 5%.
2.2 Formal Technical Definition
In quantitative histopathology and cytogenetics, the Mitotic Index () is defined as the dimensionless ratio of the number of cells displaying identifiable mitotic figures () to the total number of cells () within a standardized histological section or microscopic field of view:
Where:
- (encompassing all cells in , and phases).
2.3 Vivid Real-World Analogies
The Factory Assembly Line Snapshot:
Imagine a manufacturing plant with 1,000 workers. At 2:00 PM, a high-speed camera takes a single snapshot of the entire factory floor. If 950 workers are quietly assembling components at their individual benches (Interphase) while 50 workers are physically packing finished crates onto the delivery truck (Mitosis), the "Packaging Index" of the factory is .
The Airport Runway Analogy:
Think of an airport terminal holding 200 airplanes. If 190 planes are parked at the gates refueling, boarding passengers, and undergoing maintenance (Interphase ), while 10 planes are actively accelerating down the runway for takeoff (Mitosis), the takeoff activity index is .
3. History & Scientific Milestones
The discovery and mathematical formalization of mitotic division represent foundational breakthroughs in cellular pathology.
timeline
    title Milestones in Mitosis & Cell Cycle Kinetics
    1882 : Walther Flemming : Discovers chromosome splitting and coins 'Mitosis'
    1953 : Alma Howard & Stephen Pelc : Discover cell cycle phases (G1, S, G2, M) using autoradiography
    1957 : Bloom & Richardson : Formalize mitotic figure counting for breast cancer grading
    1991 : Elston & Ellis : Establish the standardized Nottingham Histological Mitotic Scoring system
2001 : Leland Hartwell, Tim Hunt & Paul Nurse : Win Nobel Prize for discovering cyclins and CDKs- Walther Flemming (1882): Using aniline dyes to stain salamander gill cells, the German anatomist first visualized the condensation and longitudinal splitting of nuclear threads, coining the terms "Mitosis" (from the Greek mitos, meaning warp thread) and "Chromatin".
- Alma Howard & Stephen Pelc (1953): Using radioactive isotope incorporation in Vicia faba plant roots, they proved that DNA replication occurs only during a discrete synthetic period (), separating the division cycle into four continuous phases: .
- H.J.G. Bloom & W.W. Richardson (1957) / Elston & Ellis (1991): Established the Nottingham Combined Histological Grade (Elston-Ellis Modification), standardizing mitotic figure counts per to classify invasive breast cancers into prognostic grades 1, 2, and 3.
- Leland H. Hartwell, R. Timothy Hunt, & Sir Paul M. Nurse (2001 Nobel Prize): Identified the master biochemical switches of the cell cycle—Cyclin-Dependent Kinases (CDKs) and Cyclins—explaining the molecular triggers that push cells from into active mitosis.
4. Core Concepts & Theoretical Principles
graph TD
    subgraph Cell_Cycle["The Eukaryotic Cell Cycle (Tc)"]
        G1["G₁ Phase: Cellular Growth & RNA Synthesis"] --> S["S Phase: DNA Replication (2n → 4n)"]
        S --> G2["G₂ Phase: Mitotic Preparation & Spindle Checkpoint"]
        G2 --> M["M Phase: Active Mitosis (Nm)
Prophase → Metaphase → Anaphase → Telophase"]
        M --> C["Cytokinesis: Physical Cell Cleavage"]
        C --> G1
        G1 -.-> G0["G₀ Phase: Quiescence / Senescence"]
    end

    subgraph Histology_Count["Microscopy Scoring"]
        M --> COUNT_M["Counted as Mitotic Figures (Nm)"]
        G1 --> COUNT_I["Counted as Interphase Cells (Ninterphase)"]
        S --> COUNT_I
        G2 --> COUNT_I
        G0 --> COUNT_I
    end
4.1 The 4 Mitotic Sub-Phases Counted in Histology
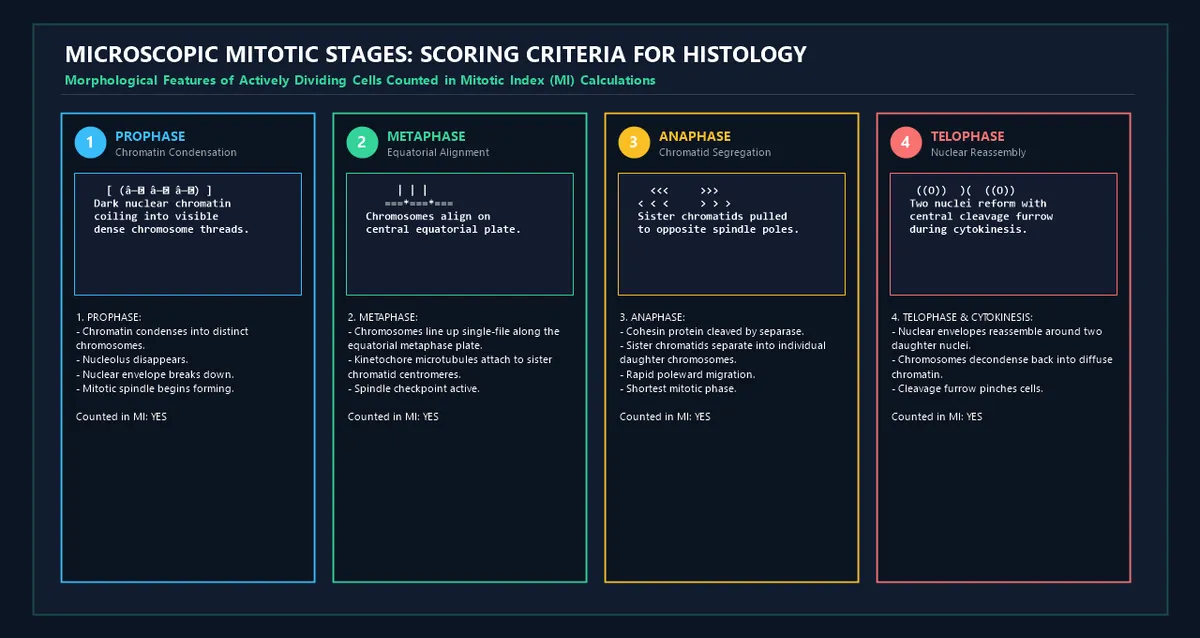
To qualify as an active mitotic figure (), a cell must exhibit distinct morphologic evidence of nuclear division: 1. Prophase: Chromatin condenses into hyperchromatic, dense, thread-like structures; the nucleolus vanishes and the nuclear membrane begins fragmentation. 2. Metaphase: Fully condensed chromosomes line up precisely along the central equatorial plane (metaphase plate). 3. Anaphase: Sister chromatids separate into two distinct, parallel V-shaped or cluster groups moving toward opposite centrosomal poles. 4. Telophase & Cytokinesis: Two daughter chromosome clusters arrive at the poles, nuclear membranes reassemble, and a visible cleavage furrow (or plant cell plate) constricts the cytoplasm.
4.2 Interphase ()
Non-dividing cells constitute the majority of any normal tissue. Under light microscopy, interphase nuclei appear round or oval with diffuse, uniformly granular chromatin, an intact nuclear membrane, and one or more visible nucleoli.
4.3 High Power Field () Standardization
In clinical diagnostic pathology, counting every cell in a specimen is impractical. Pathologists evaluate mitotic frequency across under a objective lens ( total magnification) in the most cellular, actively proliferating "hotspots" of the tumor periphery.
5. Mathematical Formulas & Derivations
5.1 The Standard Mitotic Index Equation
5.2 Calculating Phase Duration ()
In an asynchronously dividing cell population in steady-state growth, the proportion of cells observed in any phase is directly proportional to the time spent in that phase relative to the total cell cycle generation time ():
Rearranging to solve for the actual time duration of mitosis ():
Example:
If human HeLa cells have a total cycle time and an observed Mitotic Index :
5.3 Variable Reference Table
| Variable | Symbol | Typical Range | Biological Meaning | Clinical / Experimental Relevance |
|---|---|---|---|---|
| Mitotic Cells Count | Number of cells in Prophase, Metaphase, Anaphase, Telophase | Primary numerator for proliferation quantification | ||
| Total Cells Count | Total number of cells surveyed in sample | Denominator; large samples reduce Poisson counting error | ||
| Interphase Cells | Cells in quiescent or preparation phases () | |||
| Mitotic Index | Percentage of tissue actively dividing | Standard pathology marker for tumor grading | ||
| Total Cell Cycle Time | Generation time for one complete cell division | Measured experimentally via flow cytometry | ||
| Mitosis Duration | Physical duration of nuclear division | M-phase is typically the shortest cell cycle phase |
6. Step-by-Step Computational Walkthrough
Let us calculate the Mitotic Index and phase kinetics for a clinical core needle biopsy of a suspicious soft tissue sarcoma:
flowchart TD
    STEP1["Step 1: Cell Counting Under 400x HPF
Nm = 36 mitotic figures | Ntotal = 600 total cells"] --> STEP2["Step 2: Calculate Mitotic Index (MI)
MI = (36 / 600) × 100% = 6.00%"]
    STEP2 --> STEP3["Step 3: Calculate Interphase Proportion
Ninterphase = 600 - 36 = 564 cells (94.0%)"]
    STEP3 --> STEP4["Step 4: Estimate Mitotic Duration (for Tc = 20h)
TM = 0.06 × 20 hours = 1.20 hours (72 minutes)"]
    STEP4 --> STEP5["Step 5: Clinical Grading Interpretation
MI = 6.0% indicates High Proliferation Rate (Grade 3)"]- Step 1: Record Microscopy Observations:- Mitotic figures observed (): .- Total cells counted (): .- Known cell line cycle time (): .
- Step 2: Apply the Mitotic Index Formula:
- Step 3: Determine Non-Dividing Fraction:
- Step 4: Calculate Absolute Duration of Mitosis ():
- Step 5: Clinical Pathological Assessment:- Normal quiescent soft tissue exhibits .- An observed represents a 12-fold elevation in proliferative velocity, fulfilling the criterion for a High-Grade Malignant Sarcoma.
7. Visual Explanations & Histological Staging
graph TD
    CELL{"Microscope Cell Evaluation (400x H&E)"}
    CELL --> CHECK_NUC{"Is Nuclear Envelope Intact with Smooth Round Contour?"}
    CHECK_NUC -->|"Yes"| INTERPHASE["Score as INTERPHASE (G0, G1, S, G2)
Add to Ntotal (Denominator)"]
    CHECK_NUC -->|"No (Clumped / Disrupted)"| CHECK_APOP{"Are Chromatin Clumps Fragmented into Round Shrunken Beads?"}
    CHECK_APOP -->|"Yes (Pyknotic / Karyorrhectic)"| APOP["Score as APOPTOSIS / DEBRIS
Exclude from Nm!"]
    CHECK_APOP -->|"No (Dense Structured Threads)"| MITOTIC["Score as TRUE MITOTIC FIGURE (Nm)
(Prophase, Metaphase, Anaphase, Telophase)"]
8. Comparative Analysis & Diagnostic Standards
8.1 Physiological Reference Mitotic Indices in Human Tissues
| Tissue Type | Physiological Function | Typical Baseline Mitotic Index | Proliferative Classification |
|---|---|---|---|
| Small Intestine Crypts | Rapid epithelial turnover (renewed every 3–5 days) | Labile (Continuously dividing) | |
| Bone Marrow Erythroblasts | Continuous hematopoiesis ( RBCs/day) | Labile (High turnover) | |
| Basal Epidermis (Skin) | Cutaneous barrier renewal (renewed every 28 days) | Labile (Moderate turnover) | |
| Adult Liver (Hepatocytes) | Quiescent metabolic organ ( arrest) | Stable (Quiescent; re-enters cycle upon partial hepatectomy) | |
| Mature Skeletal Muscle | Multinucleated contractile syncytium | 0.00% | Permanent (Non-dividing post-mitotic) |
| Adult Neurons (Cortex) | Central nervous signaling circuitry | 0.00% | Permanent (Terminally differentiated) |
8.2 The Nottingham Combined Histological Mitotic Scoring System (Breast Cancer)
| Mitotic Score | Mitotic Figures per 10 HPFs ( field diameter) | Estimated Mitotic Index () | Histological Proliferation Grade |
|---|---|---|---|
| Score 1 | per 10 HPFs | Low proliferative activity (Favorable prognosis) | |
| Score 2 | per 10 HPFs | Intermediate proliferative activity | |
| Score 3 | per 10 HPFs | High proliferative activity (Aggressive malignancy) |
9. Practical Real-World Applications & Clinical Use Cases
Example 1: Nottingham Histological Grading in Breast Oncology
A pathologist analyzes an invasive ductal carcinoma biopsy. Across 10 standard high-power fields, exactly are counted.
- Score Assignment: Since , the tumor receives a Mitotic Score of 3.
- Clinical Implication: Combined with tubule formation (Score 3) and nuclear pleomorphism (Score 3), the overall score is (Grade 3 Poorly Differentiated Carcinoma), warranting aggressive systemic cytotoxic chemotherapy.
Example 2: Ecotoxicological Allium Cepa Bioassay
Environmental scientists monitor heavy metal contamination in municipal river runoff using the standard onion root tip (Allium cepa) test.
- Control Group (Pure Water): in .
- Treated Group (River Water): in .
- Toxicity Calculation: Mitotic inhibition growth suppression, proving severe industrial phytotoxicity.
Example 3: Antimitotic Chemotherapeutic Drug Efficacy (Paclitaxel)
In a pharmacological screen, breast cancer cell cultures are treated with Paclitaxel (a microtubule stabilizer).
- Paclitaxel prevents mitotic spindle depolymerization, trapping cancer cells at the Spindle Assembly Checkpoint (SAC) in Metaphase.
- Pre-treatment: .
- Post-treatment (24h): (Mitotic Arrest), followed by massive apoptotic catastrophe.
Example 4: Risk Stratification in Gastrointestinal Stromal Tumors (GIST)
In surgical pathology, GIST recurrence risk depends strictly on tumor size and mitotic count:
- : Low risk of metastasis.
- : High risk of metastasis, requiring adjuvant Imatinib (Gleevec) tyrosine kinase inhibitor therapy.
Example 5: Cutaneous Wound Healing & Regenerative Re-Epithelialization
Following a surgical incision, keratinocytes at the wound margin enter hyper-proliferative repair:
- Baseline undamaged epidermis: .
- Day 3 post-incision wound edge: , demonstrating active epithelial sheet migration and wound closure.
10. In-Depth Case Studies
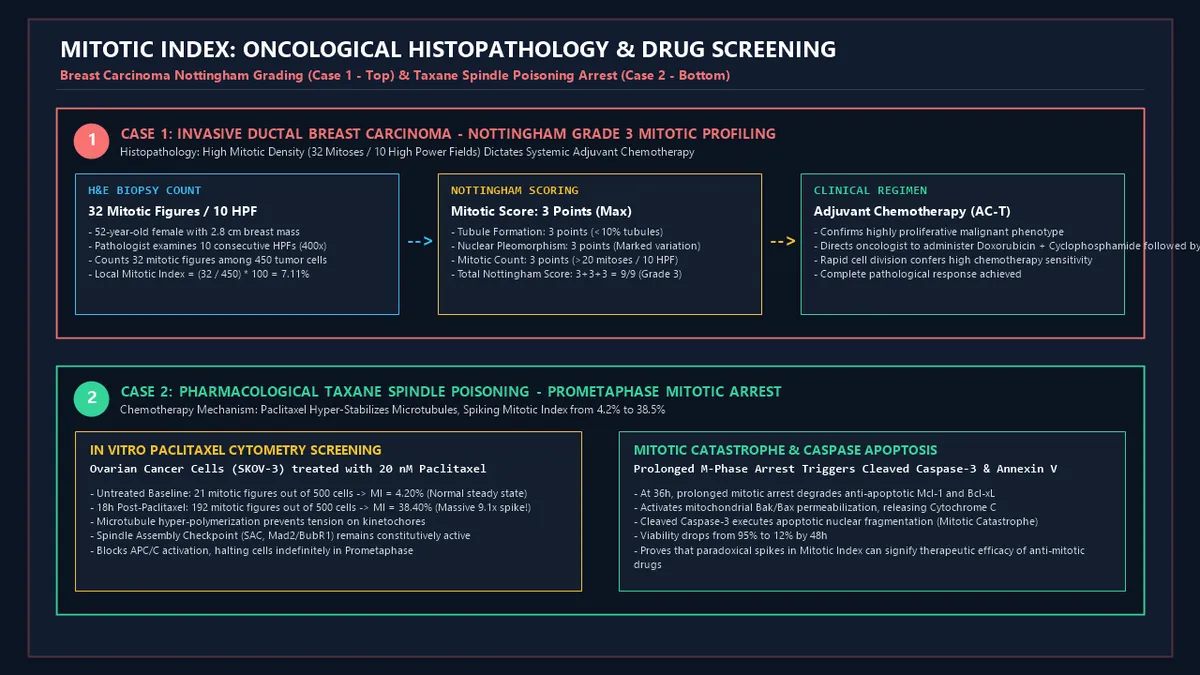
Case Study 1: Oncology Tumor Proliferation & Nottingham Breast Cancer Grading
- Clinical Context: A 52-year-old patient presents with a palpable breast mass. A core needle biopsy is fixed in buffered formalin and stained with Hematoxylin & Eosin (H&E).
- Microscopic Survey: The surgical pathologist counts 10 standardized high-power fields at the leading invasive tumor border, identifying among .
- Quantitative Calculation:
- Pathological Outcome: The tumor exhibits marked mitotic activity (Nottingham Mitotic Score 3). Because rapid cell cycling renders neoplastic cells highly susceptible to DNA-damaging agents, the multidisciplinary tumor board prescribes adjuvant Anthracycline-Taxane chemotherapy.
Case Study 2: Allium Cepa Root Apical Meristem Heavy Metal Ecotoxicology
- Experimental Setup: To evaluate the environmental safety of industrial wastewater containing cadmium ions (), Allium cepa root tips were exposed to control and wastewater solutions for 48 hours.
- Control Findings: In pure distilled water, 80 mitotic figures were scored among 800 meristematic cells:
- Contaminated Runoff Findings: In wastewater, only 16 dividing cells were observed among 800 cells:
- Biological Conclusion: Heavy metals induced an 80% reduction in mitotic index, accompanied by irregular c-mitoses, sticky metaphase chromosomes, and chromosome bridges, demonstrating potent environmental genotoxicity.
11. Advantages of Mitotic Index Analysis
- Direct Phenotypic Observation: Directly measures actual physical nuclear division rather than proxy biochemical markers.
- Cost-Effective & Universal: Requires only standard light microscopy and inexpensive histological stains (H&E, Giemsa, or Acetocarmine), accessible in any laboratory worldwide.
- Established Prognostic Power: Validated across decades of international clinical oncology trials as an independent predictor of overall survival and metastatic risk.
- Standardized Biological Bioassay: Serves as the gold-standard protocol recommended by the World Health Organization (WHO) and UNEP for environmental mutagenicity testing.
12. Biological Complexities & Histological Pitfalls
To ensure rigorous accuracy when calculating the Mitotic Index, examiners must avoid several critical histological pitfalls:
graph LR
    subgraph Pitfalls["Histological Confounders"]
        P1["Apoptotic Bodies
(Karyorrhexis / Cell Death)"]
        P2["Crush / Squeeze Artifact
(Trauma during biopsy)"]
        P3["Fixation Delay
(Cold Ischemia & Mitotic Drop)"]
        P4["Pyknotic Debris
(Dense degenerate nuclei)"]
    end
Pitfalls -->|"Mimics"| FALSE["⚠️ False Positive / Inaccurate Mitotic Index"]- Apoptotic Bodies vs. True Mitoses: Apoptosis produces fragmented, round, dense nuclear debris ("pyknosis" and "karyorrhexis") that can mimic mitotic chromosomes. True mitotic figures have distinct fibrillar chromatin without surrounding empty halos.
- Fixation Delay (Cold Ischemia Time): If surgical tissue remains un-fixed at room temperature for hours before formalin immersion, existing mitotic cells complete division or undergo autolytic decay, causing an artificial drop in observed Mitotic Index.
- Microscope Field Area Variations: Different microscope manufacturers provide field diameters ranging from to . Pathologists must standardize their counts using calibrated stage micrometers to adjust threshold tables accordingly.
13. Common Mistakes to Avoid
1. Counting Apoptotic and Pyknotic Debris as Mitotic Figures:
Dead or dying cells undergoing karyorrhexis break into irregular dark clumps. Counting apoptotic bodies inflates the Mitotic Index, leading to false high-grade cancer diagnoses.
2. Counting Only in Non-Representative Quiescent / Necrotic Zones:
Mitotic figures are concentrated in the peripheral invasive front of tumors. Scanning necrotic cores or sclerotic scar centers results in false low Mitotic Index scores.
3. Insufficient Sample Size ():
Because mitosis accounts for only of cells in most tissues, surveying fewer than 500 cells introduces severe statistical sampling error (Poisson noise).
12. Frequently Asked Questions (FAQ)
What is the formula for the Mitotic Index?
Where is the number of cells in active mitosis and is the total number of cells observed.
What is a normal Mitotic Index in healthy human tissue?
In stable adult organs like the liver or kidneys, the Mitotic Index is typically less than 0.1%. In rapidly renewing tissues like bone marrow and intestinal epithelium, normal values range from .
How does the Mitotic Index relate to cancer aggressiveness?
Higher Mitotic Indices correlate with rapid cell division, poorly differentiated histology, elevated metastatic potential, and higher tumor grades (e.g., Nottingham Grade 3 breast carcinomas).
What stages of cell division are included in the mitotic count?
All four active nuclear division phases are included: Prophase, Metaphase, Anaphase, and Telophase. Interphase () is excluded from .
How is the Mitotic Index used in plant biology?
In botanical and ecotoxicological studies, the Mitotic Index of onion (Allium cepa) or broad bean (Vicia faba) root tip meristems is used to measure growth vigor and detect genotoxic water contaminants.
What is the difference between Mitotic Index and Ki-67 labeling index?
- Mitotic Index: Measures cells currently undergoing physical mitosis (M phase only, ).
- Ki-67 Index: An immunohistochemical stain that labels all cells in the active cell cycle (), typically yielding significantly higher numerical percentages ().
How do antimitotic chemotherapy drugs affect the Mitotic Index?
Microtubule inhibitor drugs (e.g., Paclitaxel, Vincristine) prevent spindle completion, causing cells to accumulate in metaphase arrest, producing a temporary sharp rise in the observed Mitotic Index before cell death.
How many cells should be counted to obtain an accurate Mitotic Index?
In academic research and clinical studies, counting at least (or across 10 standardized high-power fields) is recommended to minimize sampling variance.
15. Expert Tips for Pathologists, Biologists & Students
- Calibrate Microscope Field Diameter: Always verify your ocular field number () and objective magnification to calculate the exact field area () for standard pathology reporting.
- Prioritize the Invasive Edge: When examining tumor biopsies, perform mitotic figure counts at the cellular peripheral tumor-host interface where active proliferation is highest.
- Use Phase-Contrast for Live Cell Assays: When evaluating live un-stained cell cultures, utilize phase-contrast optics to identify rounded, refractive mitotic cells without chemical fixation.
- Complement with Flow Cytometry: For high-throughput academic research, corroborate manual mitotic index counts with Phospho-Histone H3 (Ser10) flow cytometry labeling.
16. Summary Checklist
- ✔ Prepare Specimen: Ensure rapid, uniform formalin fixation to prevent cold ischemic mitotic decay.
- ✔ Identify Mitotic Hotspots: Locate the most cellular, viable tissue zones under scanning power.
- ✔ Count Mitotic Figures (): Tally cells strictly displaying prophase, metaphase, anaphase, or telophase morphology.
- ✔ Tally Total Cell Denominator (): Survey at least 500–1,000 cells or 10 standardized High Power Fields.
- ✔ Execute Calculation: Apply .
- ✔ Correlate with Clinical Context: Compare against organ-specific reference ranges and Nottingham criteria.
Additional Technical Guidelines & Measurement Standards
When conducting calculations for Mitotic Cell Division Index Calculator, maintaining quantitative precision and verifying input parameter boundaries is essential for reliable scenario evaluation. Always verify that raw numerical inputs are measured using standardized instrumentation, and double-check unit conversions prior to applying outputs in commercial, industrial, or academic projects.
For quantitative unit conversions and scientific calculations, always maintain at least four decimal places of precision during intermediate arithmetic stages before rounding final results. When preparing technical reports, laboratory documentation, or financial forecasts, cross-verify all output variables against established international measurement standards (such as SI, NIST, and ISO metric benchmarks) to guarantee consistent analytical rigor across all computational workflows.
MathsLover.com delivers this interactive solver 100% free of charge to foster global mathematical literacy, educational accessibility, and data-driven problem solving across scientific, technical, and academic communities worldwide.